
PUBLISHER: Global Market Insights Inc. | PRODUCT CODE: 1928988

PUBLISHER: Global Market Insights Inc. | PRODUCT CODE: 1928988
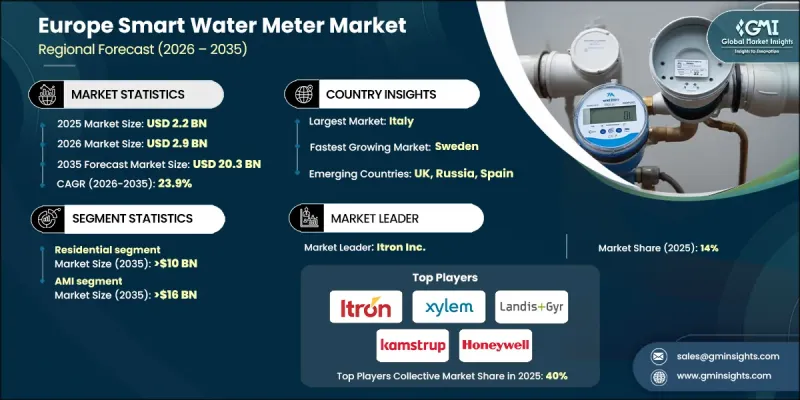
Europe Smart Water Meter Market Opportunity, Growth Drivers, Industry Trend Analysis, and Forecast 2026 - 2035
Europe Smart Water Meter Market was valued at USD 2.2 billion in 2025 and is estimated to grow at a CAGR of 23.9% to reach USD 20.3 billion by 2035.
Market expansion is driven by regulatory mandates and efficiency initiatives across the region. EU directives such as 2006/32/EC and the Clean Energy for All Europeans package (Directive 2019/944) emphasize sustainable resource use and encourage the rollout of smart meters, including water meters. Addressing "non-revenue water" (NRW), which includes water lost due to leaks, theft, or inefficiencies, is a major priority, as over 20% of treated water is reportedly lost annually, costing utilities billions. Smart water meters equipped with real-time monitoring, leak detection, and IoT connectivity are pivotal in curbing these losses. Strategic government investments, EU-funded projects, and standardized platforms like DLMS/COSEM for interoperability have accelerated adoption. Companies such as Kamstrup, Landis+Gyr, and Xylem are expanding production to meet rising demand, while analytics-enabled back-end systems are optimizing resource allocation, predicting demand patterns, and detecting anomalies across urban and industrial water networks.
| Market Scope | |
|---|---|
| Start Year | 2025 |
| Forecast Year | 2026-2035 |
| Start Value | $2.2 Billion |
| Forecast Value | $20.3 Billion |
| CAGR | 23.9% |
The residential segment is anticipated to reach USD 10 billion by 2035, driven by consumer demand for real-time monitoring and water conservation. Residential smart meters enable households to track usage, reduce wastage, and align with EU water efficiency goals. In Mediterranean regions prone to drought, government-funded programs are accelerating smart meter adoption in homes, reflecting an increasing focus on sustainability. By empowering consumers with usage insights, residential meters are transforming everyday water management while supporting national water conservation targets. This trend underscores the growing influence of households in promoting responsible water usage across Europe.
The Advanced Metering Infrastructure (AMI) segment is projected to reach USD 16 billion by 2035, growing at a CAGR of 25%. AMI systems provide continuous, high-frequency communication between meters and utilities, enabling leak detection, remote management, and dynamic billing. European utilities prefer AMI for its operational efficiency and potential to reduce non-revenue water, offering more functionality than legacy Automated Meter Reading (AMR) systems. Countries leading in LPWAN adoption, including NB-IoT networks, are paving the way for advanced AMI deployments, ensuring high connectivity and enabling smart city water management solutions.
Germany Smart Water Meter Market is expected to reach USD 3.5 billion by 2035, supported by industrial initiatives like large-scale green hydrogen production that require precise water monitoring. Utilities are deploying AMI-enabled meters in industrial clusters to ensure real-time monitoring, efficient usage, and compliance with EU water directives. Industrial expansion in energy-intensive sectors is increasing demand for advanced metering solutions, positioning Germany as a leading adopter within Europe's transition toward sustainable water and energy management.
Major players in the Europe Smart Water Meter Market include Landis+Gyr, Kamstrup, ABB, Schneider Electric, Siemens, Honeywell International Inc., Badger Meter, Inc., Xylem (Sensus), EMH Metering, Apator S.A., Baylan Water Meters, Maddalena S.p.A, BMETERS S.r.l, Diehl Stiftung & Co. KG, Sontex SA, Arad Group, STMicroelectronics, WaterTech S.p.A, and ZENNER International GmbH & Co. KG. These companies are leveraging innovations, scale, and partnerships to capture market share and meet growing demand across residential, commercial, and industrial sectors. To strengthen their position, companies in the Europe Smart Water Meter Market are adopting multiple strategies. They are expanding production capacity and scaling operations to meet increasing residential and industrial demand. Investments in research and development focus on enhanced IoT integration, energy-efficient metering, and AI-powered analytics for predictive maintenance. Strategic alliances with utilities, governments, and smart city initiatives allow companies to participate in large-scale rollouts and infrastructure projects.
Table of Contents
Chapter 1 Methodology & Scope
- 1.1 Research design
- 1.2 Market estimates & forecast parameters
- 1.3 Forecast calculation
- 1.4 Data sources
- 1.4.1 Primary
- 1.4.2 Secondary
- 1.4.2.1 Paid
- 1.4.2.2 Public
Chapter 2 Executive Summary
- 2.1 Industry synopsis, 2022 - 2035
Chapter 3 Industry Insights
- 3.1 Industry ecosystem analysis
- 3.1.1 Raw material availability landscape
- 3.1.2 Factors affecting the value chain
- 3.1.3 Disruptions
- 3.2 Regulatory landscape
- 3.3 Industry impact forces
- 3.3.1 Growth drivers
- 3.3.2 Industry pitfalls & challenges
- 3.4 Growth potential analysis
- 3.5 Porter';s analysis
- 3.5.1 Bargaining power of suppliers
- 3.5.2 Bargaining power of buyers
- 3.5.3 Threat of new entrants
- 3.5.4 Threat of substitutes
- 3.6 PESTEL analysis
- 3.6.1 Political factors
- 3.6.2 Economic factors
- 3.6.3 Social factors
- 3.6.4 Technological factors
- 3.6.5 Legal factors
- 3.6.6 Environmental factors
- 3.7 Emerging opportunities & trends
- 3.8 Investment analysis & future outlook
Chapter 4 Competitive Landscape, 2025
- 4.1 Introduction
- 4.2 Company market share, by country, 2025
- 4.2.1 UK
- 4.2.2 Germany
- 4.2.3 Russia
- 4.2.4 Italy
- 4.2.5 Spain
- 4.2.6 Sweden
- 4.3 Strategic initiatives
- 4.4 Competitive benchmarking depictions
- 4.5 Strategy dashboard
- 4.6 Innovation & technology landscape
Chapter 5 Market Size and Forecast, By Application, 2022 - 2035 (USD Million, '000 Units)
- 5.1 Key trends
- 5.2 Residential
- 5.3 Commercial
- 5.4 Utility
Chapter 6 Market Size and Forecast, By Technology, 2022 - 2035 (USD Million, '000 Units)
- 6.1 Key trends
- 6.2 AMI
- 6.3 AMR
Chapter 7 Market Size and Forecast, By Product, 2022 - 2035 (USD Million, '000 Units)
- 7.1 Key trends
- 7.2 Hot water meter
- 7.3 Cold water meter
Chapter 8 Market Size and Forecast, By Country, 2022 - 2035 (USD Million, '000 Units)
- 8.1 Key trends
- 8.2 UK
- 8.3 Germany
- 8.4 Russia
- 8.5 Italy
- 8.6 Spain
- 8.7 Sweden
Chapter 9 Company Profiles
- 9.1 ABB
- 9.2 Apator S.A.
- 9.3 Arad Group
- 9.4 Badger Meter, Inc.
- 9.5 Baylan Water Meters
- 9.6 BMETERS S.r.l
- 9.7 Diehl Stiftung & Co. KG
- 9.8 EMH Metering
- 9.9 Honeywell International Inc.
- 9.10 Itron Inc.
- 9.11 Kamstrup
- 9.12 Landis+Gyr
- 9.13 Maddalena S.p.A
- 9.14 Schneider Electric
- 9.15 Siemens
- 9.16 Sontex SA
- 9.17 STMicroelectronics
- 9.18 WaterTech S.p.A
- 9.19 Xylem (Sensus)
- 9.20 ZENNER International GmbH & Co. Kg

