
PUBLISHER: Global Market Insights Inc. | PRODUCT CODE: 1666682

PUBLISHER: Global Market Insights Inc. | PRODUCT CODE: 1666682
North America Distribution Transformer Market Opportunity, Growth Drivers, Industry Trend Analysis, and Forecast 2025 - 2034
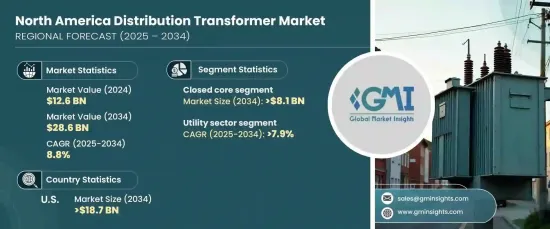
North America Distribution Transformer Market, valued at USD 12.6 billion in 2024, is set to witness significant growth at a CAGR of 8.8% between 2025 and 2034. This expansion is primarily fueled by an increasing focus on sustainable, eco-friendly technologies. As environmental regulations tighten and climate change concerns escalate, energy-efficient and low-emission transformers are becoming essential in meeting the demands of modern power systems. The market is also being shaped by advancements in manufacturing processes, with leading manufacturers prioritizing the development of sustainable products that incorporate recyclable materials and reduce energy losses in transformer designs.
Simultaneously, urbanization and industrial growth across North America are driving the demand for reliable power distribution systems to support new industries and residential developments. Distribution transformers, as a cornerstone of these systems, play a pivotal role in meeting the electricity needs of these expanding sectors. Moreover, the integration of smart grid technologies, including intelligent load management, remote monitoring, and predictive maintenance capabilities, is further boosting demand for advanced transformer solutions designed to enhance efficiency and reliability within power distribution networks.
| Market Scope | |
|---|---|
| Start Year | 2024 |
| Forecast Year | 2025-2034 |
| Start Value | $12.6 Billion |
| Forecast Value | $28.6 Billion |
| CAGR | 8.8% |
By core type, the market reveals a growing preference for closed core transformers, expected to generate USD 8.1 billion by 2034. These transformers are prized for their ability to minimize core losses and optimize performance, making them a preferred choice in sectors such as automotive and renewable energy that demand high efficiency and low operational costs. With ongoing innovation and improvements in manufacturing techniques, closed core transformers are anticipated to experience steady demand growth, particularly as industries seek solutions to address energy efficiency challenges while reducing overall costs.
The market is also segmented by application, with the utility sector emerging as a key growth driver. This sector is anticipated to achieve a robust CAGR of 7.9% through 2034, supported by heightened investments in grid infrastructure and a growing emphasis on renewable energy. Utilities are modernizing their networks to improve energy distribution and accommodate green energy solutions. The deployment of advanced technologies, such as energy storage systems, intelligent substations, and state-of-the-art transformers, is critical in meeting these modernization goals while ensuring reliable power delivery.
The US distribution transformer market alone is forecast to reach USD 18.7 billion by 2034, driven by rapid urbanization, large-scale infrastructure developments, and the transition to renewable energy sources like wind and solar. The need for transformers capable of integrating variable power inputs into the grid is growing, and investments in smart grid technologies and rural electrification initiatives are further propelling market expansion. These factors position the distribution transformer sector for significant growth and underscore its critical role in advancing North America's energy infrastructure.
Table of Contents
Chapter 1 Methodology & Scope
- 1.1 Market definitions
- 1.2 Base estimates & calculations
- 1.3 Forecast calculation
- 1.4 Data sources
- 1.4.1 Primary
- 1.4.2 Secondary
- 1.4.2.1 Paid
- 1.4.2.2 Public
Chapter 2 Industry Insights
- 2.1 Industry ecosystem analysis
- 2.2 Regulatory landscape
- 2.3 Industry impact forces
- 2.3.1 Growth drivers
- 2.3.2 Industry pitfalls & challenges
- 2.4 Growth potential analysis
- 2.5 Porter's analysis
- 2.5.1 Bargaining power of suppliers
- 2.5.2 Bargaining power of buyers
- 2.5.3 Threat of new entrants
- 2.5.4 Threat of substitutes
- 2.6 PESTEL analysis
Chapter 3 Competitive landscape, 2024
- 3.1 Strategic dashboard
- 3.2 Innovation & sustainability landscape
Chapter 4 Market Size and Forecast, By Core, 2021 – 2034 (Units & USD Million)
- 4.1 Key trends
- 4.2 Closed
- 4.3 Shell
- 4.4 Berry
Chapter 5 Market Size and Forecast, By Winding, 2021 – 2034 (Units & USD Million)
- 5.1 Key trends
- 5.2 Two winding
- 5.3 Auto transformer
Chapter 6 Market Size and Forecast, By Cooling, 2021 – 2034 (Units & USD Million)
- 6.1 Key trends
- 6.2 Dry type
- 6.3 Oil immersed
Chapter 7 Market Size and Forecast, By Insulation, 2021 – 2034 (Units & USD Million)
- 7.1 Key trends
- 7.2 Gas
- 7.3 Oil
- 7.4 Solid
- 7.5 Air
- 7.6 Others
Chapter 8 Market Size and Forecast, By Rating, 2021 – 2034 (Units & USD Million)
- 8.1 Key trends
- 8.2 ≤ 2.5 MVA
- 8.3 2.6 MVA to 10 MVA
- 8.4 > 10 MVA
Chapter 9 Market Size and Forecast, By Application, 2021 – 2034 (Units & USD Million)
- 9.1 Key trends
- 9.2 Residential & commercial
- 9.3 Utility
- 9.4 Industrial
Chapter 10 Market Size and Forecast, By Country, 2021 – 2034 (Units & USD Million)
- 10.1 Key trends
- 10.2 U.S.
- 10.3 Canada
- 10.4 Mexico
Chapter 11 Company Profiles
- 11.1 ABB
- 11.2 Celme
- 11.3 CG Power
- 11.4 Eaton
- 11.5 Elsewedy
- 11.6 Ermco
- 11.7 General Electric
- 11.8 Hitachi
- 11.9 Hyosung
- 11.10 Mitsubishi
- 11.11 Ormazabal
- 11.12 Schneider
- 11.13 Siemens
- 11.14 Toshiba

