
PUBLISHER: Global Market Insights Inc. | PRODUCT CODE: 1684864

PUBLISHER: Global Market Insights Inc. | PRODUCT CODE: 1684864
U.S. Transmission Lines Market Opportunity, Growth Drivers, Industry Trend Analysis, and Forecast 2025 - 2034
U.S. Transmission Lines Market was valued at USD 958.1 million in 2024 and is projected to grow at a CAGR of 3.1% between 2025 and 2034. This growth is driven by a combination of factors, including the increasing need to replace aging grid infrastructure, the expansion of operational territories, and the modernization of power systems across the country. As electricity demand continues to rise, the U.S. is focusing on the deployment of advanced, high-strength transmission lines, which are expected to improve grid efficiency, safety, and sustainability. Additionally, efforts to integrate renewable energy sources, such as solar and wind power, into national grids are playing a critical role in driving the market forward. Over the forecast period, these developments will significantly transform the energy grid, making it more reliable and resilient to challenges posed by a changing environment and growing urbanization.
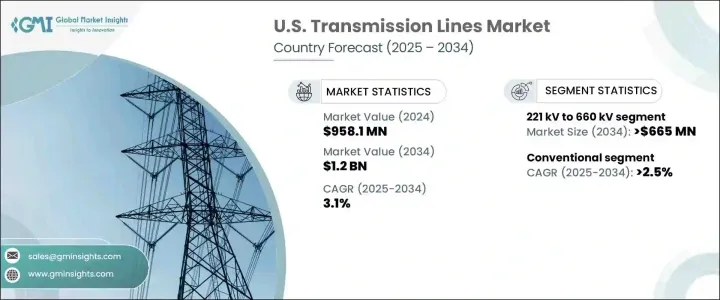
Transmission lines with capacities ranging from 221kV to 660kV will generate USD 665 million by 2034. The demand for these high-voltage transmission lines is being propelled by utilities working to modernize infrastructure for long-range electricity transmission, particularly in areas with growing power demands. These upgrades are crucial for expanding energy access, boosting grid stability, and ensuring the efficient transfer of electricity. The increasing efforts to restructure outdated electrical systems in the commercial, industrial, and utility sectors are also reshaping the industry's landscape. As power grids evolve, the integration of renewable energy plays a pivotal role in optimizing the energy network, especially as clean energy adoption accelerates across the nation.
| Market Scope | |
|---|---|
| Start Year | 2024 |
| Forecast Year | 2025-2034 |
| Start Value | $958.1 Million |
| Forecast Value | $1.2 Billion |
| CAGR | 3.1% |
Meanwhile, the conventional transmission lines segment is expected to see a CAGR of 2.5% through 2034. Grid modernization, rising electricity demand, and greater adoption of renewable energy sources are supporting the growth of this segment. The adoption of new technologies, such as aluminum composite conductors and digital monitoring systems, is enhancing grid reliability, boosting system efficiency, and reducing maintenance costs. These innovations are helping utilities meet energy demands while maintaining high levels of operational reliability.
By 2034, the U.S. transmission lines market is expected to generate USD 1.2 billion. Policies like the Infrastructure Investment and Jobs Act have played a key role in catalyzing investment in transmission infrastructure, pushing for a more robust and modernized energy grid. At the same time, the growing adoption of underground transmission lines is reducing environmental impacts and offering better reliability, especially in areas vulnerable to severe weather conditions. As the energy industry continues to evolve, these technological advancements and policy-driven investments are reshaping the future of transmission lines, contributing to a more efficient, sustainable, and resilient energy network.
Table of Contents
Chapter 1 Methodology & Scope
- 1.1 Market scope & definitions
- 1.2 Market estimates & forecast parameters
- 1.3 Forecast calculation
- 1.4 Data sources
- 1.4.1 Primary
- 1.4.2 Secondary
- 1.4.2.1 Paid
- 1.4.2.2 Public
Chapter 2 Industry Insights
- 2.1 Industry ecosystem analysis
- 2.2 Regulatory landscape
- 2.3 Industry impact forces
- 2.3.1 Growth drivers
- 2.3.2 Industry pitfalls & challenges
- 2.4 Growth potential analysis
- 2.5 Porter's analysis
- 2.5.1 Bargaining power of suppliers
- 2.5.2 Bargaining power of buyers
- 2.5.3 Threat of new entrants
- 2.5.4 Threat of substitutes
- 2.6 PESTEL analysis
Chapter 3 Competitive Landscape, 2024
- 3.1 Introduction
- 3.2 Strategic outlook
- 3.3 Innovation & sustainability landscape
Chapter 4 Market Size and Forecast, By Voltage, 2021 – 2034 (ckm, USD Million)
- 4.1 Key trends
- 4.2 132 kV to 220 kV
- 4.3 221 kV to 660 kV
- 4.4 > 660 kV
Chapter 5 Market Size and Forecast, By Conductor, 2021 – 2034 (ckm, USD Million)
- 5.1 Key trends
- 5.2 Conventional
- 5.3 High temperature
- 5.4 Others
Chapter 6 Company Profiles
- 6.1 American Wire Group
- 6.2 APAR Industries
- 6.3 Bekaert
- 6.4 CTC Global
- 6.5 Houston Wire & Cable
- 6.6 Nexans
- 6.7 Prysmian Group
- 6.8 Quanta Services
- 6.9 Siemens Energy
- 6.10 Southwire Company
- 6.11 Sumitomo Electric Industries
- 6.12 TS Conductor

