
PUBLISHER: Global Market Insights Inc. | PRODUCT CODE: 1667148

PUBLISHER: Global Market Insights Inc. | PRODUCT CODE: 1667148
Asia Pacific Distribution Transformer Market Opportunity, Growth Drivers, Industry Trend Analysis, and Forecast 2025 - 2034
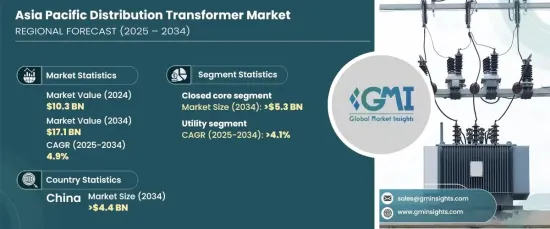
Asia Pacific Distribution Transformer Market, valued at USD 10.3 billion in 2024, is projected to grow at a CAGR of 4.9% from 2025 to 2034. This growth is largely driven by the rapid urbanization and industrial development taking place in the region. As cities expand and new industrial zones are established, the demand for stable and reliable electricity is increasing. This surge in energy demand is fueling the need for efficient distribution transformers that can ensure smooth power delivery across various sectors.
The transition towards renewable energy sources such as solar and wind is also reshaping the distribution transformer market in Asia Pacific. Countries in the region are actively pursuing ambitious renewable energy goals, which require transformers that can handle fluctuating power inputs. As part of ongoing efforts to modernize the grid, there is a growing focus on incorporating smart transformers equipped with features like real-time monitoring and adaptive load management. These innovations are essential to support the integration of renewable energy into existing electrical systems, which helps reduce energy losses and maintain grid stability.
| Market Scope | |
|---|---|
| Start Year | 2024 |
| Forecast Year | 2025-2034 |
| Start Value | $10.3 Billion |
| Forecast Value | $17.1 Billion |
| CAGR | 4.9% |
The closed core segment of the market is expected to reach USD 5.3 billion by 2034, driven by the increasing energy demands of expanding urban and industrial areas. Closed core transformers are gaining popularity due to their high efficiency and compact design, making them ideal for applications that require minimal energy loss. Their widespread adoption is also being spurred by the growing need for renewable energy integration and grid modernization projects.
The utility segment is anticipated to see significant growth, with a CAGR of over 4.1% through 2034. Rising electricity demand, along with continuous grid upgrades, is fueling the expansion of utility-scale distribution transformers in the region. Governments across Asia Pacific are investing heavily in infrastructure projects to support urbanization, industrial growth, and rural electrification, which in turn is boosting demand for advanced transformers.
The distribution transformer market in Asia Pacific, especially in countries with a focus on renewable energy and grid efficiency, is poised for continued growth. Investments in smart grids, eco-friendly transformer technologies, and energy efficiency will further drive market expansion, making it a key segment to watch in the coming years.
Table of Contents
Chapter 1 Methodology & Scope
- 1.1 Market definitions
- 1.2 Base estimates & calculations
- 1.3 Forecast calculation
- 1.4 Data sources
- 1.4.1 Primary
- 1.4.2 Secondary
- 1.4.2.1 Paid
- 1.4.2.2 Public
Chapter 2 Industry Insights
- 2.1 Industry ecosystem analysis
- 2.2 Regulatory landscape
- 2.3 Industry impact forces
- 2.3.1 Growth drivers
- 2.3.2 Industry pitfalls & challenges
- 2.4 Growth potential analysis
- 2.5 Porter's analysis
- 2.5.1 Bargaining power of suppliers
- 2.5.2 Bargaining power of buyers
- 2.5.3 Threat of new entrants
- 2.5.4 Threat of substitutes
- 2.6 PESTEL analysis
Chapter 3 Competitive landscape, 2024
- 3.1 Strategic dashboard
- 3.2 Innovation & sustainability landscape
Chapter 4 Market Size and Forecast, By Core, 2021 – 2034 (Units & USD Million)
- 4.1 Key trends
- 4.2 Closed
- 4.3 Shell
- 4.4 Berry
Chapter 5 Market Size and Forecast, By Winding, 2021 – 2034 (Units & USD Million)
- 5.1 Key trends
- 5.2 Two winding
- 5.3 Auto transformer
Chapter 6 Market Size and Forecast, By Cooling, 2021 – 2034 (Units & USD Million)
- 6.1 Key trends
- 6.2 Dry type
- 6.3 Oil immersed
Chapter 7 Market Size and Forecast, By Insulation, 2021 – 2034 (Units & USD Million)
- 7.1 Key trends
- 7.2 Gas
- 7.3 Oil
- 7.4 Solid
- 7.5 Air
- 7.6 Others
Chapter 8 Market Size and Forecast, By Rating, 2021 – 2034 (Units & USD Million)
- 8.1 Key trends
- 8.2 ≤ 2.5 MVA
- 8.3 2.6 MVA to 10 MVA
- 8.4 > 10 MVA
Chapter 9 Market Size and Forecast, By Application, 2021 – 2034 (Units & USD Million)
- 9.1 Key trends
- 9.2 Residential & commercial
- 9.3 Utility
- 9.4 Industrial
Chapter 10 Market Size and Forecast, By Country, 2021 – 2034 (Units & USD million)
- 10.1 Key trends
- 10.2 China
- 10.3 Japan
- 10.4 South Korea
- 10.5 India
- 10.6 Australia
Chapter 11 Company Profiles
- 11.1 ABB
- 11.2 CG Power
- 11.3 Eaton
- 11.4 Elsewedy
- 11.5 General Electric
- 11.6 Hitachi
- 11.7 Hyosung
- 11.8 Imefy
- 11.9 Mitsubishi
- 11.10 Ormazabal
- 11.11 Schneider
- 11.12 Siemens
- 11.13 Toshiba
- 11.14 Voltamp

