
PUBLISHER: Global Market Insights Inc. | PRODUCT CODE: 1750610

PUBLISHER: Global Market Insights Inc. | PRODUCT CODE: 1750610
Europe Waste Heat Recovery Systems Market Opportunity, Growth Drivers, Industry Trend Analysis, and Forecast 2025 - 2034
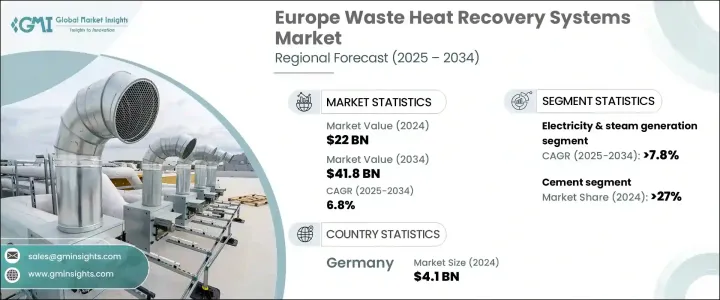
Europe Waste Heat Recovery Systems Market was valued at USD 22 billion in 2024 and is estimated to grow at a CAGR of 6.8% to reach USD 41.8 billion by 2034, driven by increasing regulatory requirements, environmental concerns, and technological advancements. Waste heat recovery (WHR) systems play a crucial role in capturing unused energy during industrial processes, reducing overall energy consumption, and cutting greenhouse gas emissions. Governments around the world are stepping up efforts to capture CO2 emissions and work toward net-zero goals, with a focus on reducing environmental impacts. In the European Union, the Energy Efficiency Directive mandates that member states implement specific WHR targets, encouraging businesses to invest in energy-saving technologies.
The European Union-funded ETEKINA project has helped advance technologies to reduce environmental harm by efficiently recycling industrial heat. This initiative supports the EU's commitment to achieving pollution-free energy solutions and significantly contributes to the region's ambitious sustainability goals. By developing cutting-edge methods for capturing and repurposing waste heat, the ETEKINA project is helping industries lower their carbon footprints and improve energy efficiency. The project aligns with the EU's ongoing efforts to transition toward a greener, more sustainable economy, positioning it as a leader in the global push for net-zero emissions by mid-century.
| Market Scope | |
|---|---|
| Start Year | 2024 |
| Forecast Year | 2025-2034 |
| Start Value | $22 Billion |
| Forecast Value | $41.8 Billion |
| CAGR | 6.8% |
The market is segmented based on application, including pre-heating, electricity and steam generation, and others. The electricity and steam generation segment is expected to grow at a CAGR of 7.8% by 2034, driven by heightened focus on combating climate change. Electricity generation from waste heat recovery involves using thermal energy to generate power through technologies like the Organic Rankine Cycle (ORC) or Kalina cycle. Energy-intensive industries such as cement, glass, and metal manufacturing are increasingly adopting these technologies, driving market growth.
The cement industry holds a dominant market share, contributing 27% in 2024 due to the high temperatures in cement production and the adoption of newer, energy-efficient technologies, supported by favorable government policies. As industries continue to scale up operations, the demand for waste heat recovery systems will only rise, creating significant market potential.
Germany Waste Heat Recovery Market was valued at USD 4.1 billion in 2024, benefiting from technological advancements and stringent environmental policies. The country is at the forefront of integrating waste heat recovery systems into its energy transition plans. The Renewable Energy Sources Act (EEG) has transitioned from feed-in tariffs to auction systems, promoting cost-efficient solutions like waste heat recovery. Furthermore, the German government is speeding up approvals for technologies such as geothermal energy, heat pumps, and heat storage units to reduce dependence on fossil fuels.
Key players in the Europe Waste Heat Recovery Systems Market include Bosch Industriekessel GmbH, Climeon, Danfoss, Forbes Marshall, General Electric, Siemens Energy, Ormat, MITSUBISHI HEAVY INDUSTRIES, LTD., Promec Engineering, Viessman, and AURA. To strengthen their presence in the European market, companies focus on several strategies, such as developing advanced waste heat recovery technologies, forming partnerships with industrial players, and increasing investments in research and development. Collaborations with governmental agencies are also helping companies access funding and support for large-scale projects, particularly in the context of energy transition and decarbonization goals. Additionally, some companies are diversifying their product portfolios by introducing modular and scalable solutions tailored to the needs of various industrial sectors, such as cement and metal manufacturing.
Table of Contents
Chapter 1 Methodology & Scope
- 1.1 Market scope & definitions
- 1.2 Market estimates & forecast parameters
- 1.3 Forecast calculation
- 1.4 Data sources
- 1.4.1 Primary
- 1.4.2 Secondary
- 1.4.2.1 Paid
- 1.4.2.2 Public
Chapter 2 Industry Insights
- 2.1 Industry ecosystem analysis
- 2.2 Trump administration tariffs analysis
- 2.2.1 Impact on trade
- 2.2.1.1 Trade volume disruptions
- 2.2.1.2 Retaliatory measures
- 2.2.2 Impact on the industry
- 2.2.2.1 Supply-side impact (raw materials)
- 2.2.2.1.1 Price volatility in key materials
- 2.2.2.1.2 Supply chain restructuring
- 2.2.2.1.3 Production cost implications
- 2.2.2.2 Demand-side impact (selling price)
- 2.2.2.2.1 Price transmission to end markets
- 2.2.2.2.2 Market share dynamics
- 2.2.2.2.3 Consumer response patterns
- 2.2.2.1 Supply-side impact (raw materials)
- 2.2.3 Key companies impacted
- 2.2.4 Strategic industry responses
- 2.2.4.1.1 Supply chain reconfiguration
- 2.2.4.1.2 Pricing and product strategies
- 2.2.4.1.3 Policy engagement
- 2.2.5 Outlook and future considerations
- 2.2.1 Impact on trade
- 2.3 Regulatory landscape
- 2.4 Industry impact forces
- 2.4.1 Growth drivers
- 2.4.2 Industry pitfalls & challenges
- 2.5 Growth potential analysis
- 2.6 Porter's analysis
- 2.6.1 Bargaining power of suppliers
- 2.6.2 Bargaining power of buyers
- 2.6.3 Threat of new entrants
- 2.6.4 Threat of substitutes
- 2.7 PESTEL analysis
Chapter 3 Competitive Landscape, 2025
- 3.1 Introduction
- 3.2 Company market share analysis, 2024
- 3.3 Strategic dashboard
- 3.4 Strategic initiative
- 3.5 Competitive benchmarking
- 3.6 Innovation & technology landscape
Chapter 4 Market Size and Forecast, By Application, 2021 - 2034 (USD Billion)
- 4.1 Pre-heating
- 4.2 Electricity & steam generation
- 4.2.1 Steam rankine cycle
- 4.2.2 Organic rankine cycle
- 4.2.3 Kalina cycle
- 4.3 Other
Chapter 5 Market Size and Forecast, By Temperature, 2021 - 2034 (USD Billion)
- 5.1 Key trends
- 5.2 < 230 °C
- 5.3 230°C - 650 °C
- 5.4 > 650 °C
Chapter 6 Market Size and Forecast, By End Use, 2021 - 2034 (USD Billion)
- 6.1 Key trends
- 6.2 Petroleum refining
- 6.3 Cement
- 6.4 Heavy metal manufacturing
- 6.5 Chemical
- 6.6 Pulp & paper
- 6.7 Food & beverage
- 6.8 Glass
- 6.9 Other
Chapter 7 Market Size and Forecast, By Country, 2021 - 2034 (USD Billion)
- 7.1 Key trends
- 7.2 Germany
- 7.3 UK
- 7.4 France
- 7.5 Italy
- 7.6 Spain
Chapter 8 Company Profiles
- 8.1 Baker Hughes
- 8.2 BIHL
- 8.3 AURA
- 8.4 Bosch Industriekessel GmbH
- 8.5 Climeon
- 8.6 Cochran
- 8.7 Danfoss
- 8.8 E.ON
- 8.9 Durr Group
- 8.10 EXERGY INTERNATIONAL SRL
- 8.11 Forbes Marshall
- 8.12 Fortum
- 8.13 General Electric
- 8.14 HRS
- 8.15 MITSUBISHI HEAVY INDUSTRIES, LTD.
- 8.16 Ormat
- 8.17 Orcan Energy
- 8.18 Promec Engineering
- 8.19 Siemens Energy
- 8.20 Sofinter S.p.a
- 8.21 Viessman

