
PUBLISHER: Global Market Insights Inc. | PRODUCT CODE: 1716546

PUBLISHER: Global Market Insights Inc. | PRODUCT CODE: 1716546
Blood Drawing Chairs Market Opportunity, Growth Drivers, Industry Trend Analysis, and Forecast 2025 - 2034
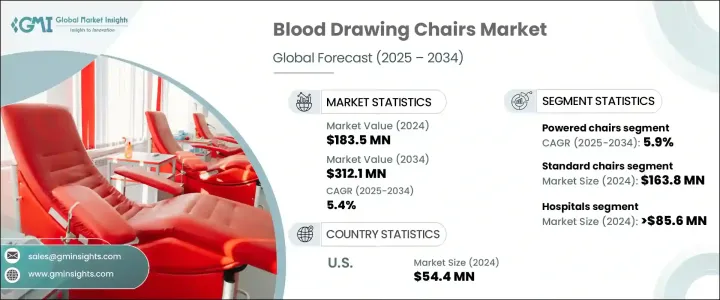
The Global Blood Drawing Chairs Market reached USD 183.5 million in 2024 and is projected to grow at a CAGR of 5.4% between 2025 and 2034. The steady expansion of this market is largely fueled by the growing number of diagnostic centers, hospitals, and clinics worldwide, alongside a rising global demand for blood donations. As chronic diseases such as diabetes, cardiovascular conditions, and cancer continue to escalate, routine blood tests and diagnostic screenings are becoming essential, further driving the demand for efficient and patient-friendly blood collection solutions. Healthcare providers are increasingly focusing on enhancing patient comfort and safety during procedures, and specialized equipment like blood drawing chairs has become indispensable for ensuring smooth and effective blood collection processes.
These chairs are designed to support patients of all ages and physical conditions, helping healthcare professionals carry out blood draws with ease while minimizing patient discomfort. Additionally, the rapid expansion of home healthcare services and mobile phlebotomy units, especially in developed economies, is pushing the demand for portable and automated blood drawing chairs. Innovations in chair design, including enhanced ergonomics and motorized adjustments, are also contributing to market growth by allowing healthcare providers to handle a higher volume of patients efficiently while maintaining quality care standards.
| Market Scope | |
|---|---|
| Start Year | 2024 |
| Forecast Year | 2025-2034 |
| Start Value | $183.5 Million |
| Forecast Value | $312.1 Million |
| CAGR | 5.4% |
The market is broadly segmented into manual and powered blood drawing chairs, with powered chairs expected to exhibit a 5.9% CAGR from 2025 to 2034. The increasing preference for powered chairs stems from their enhanced functionality and ease of use. These chairs allow healthcare staff to adjust the height and position smoothly, significantly improving both patient and clinician comfort during blood collection. The multifunctionality of powered chairs also makes them suitable for various medical applications beyond routine blood draws, including minor procedures and examinations, driving their wider adoption across healthcare facilities. As healthcare providers focus on improving patient outcomes and reducing procedural time, the versatility and efficiency of powered blood drawing chairs make them a preferred choice in modern medical environments.
In terms of end users, hospitals, blood donation centers, diagnostic labs, and other medical facilities represent key segments. The hospital segment accounted for USD 85.6 million in 2024, reflecting the substantial use of blood drawing chairs in inpatient and outpatient settings. Hospitals rely on these chairs to facilitate routine diagnostic testing and pre-surgical evaluations, ensuring patients are positioned comfortably during blood draws. Furthermore, healthcare centers in rural and underserved regions are playing a vital role in fueling demand, as they frequently organize blood donation drives and community health camps that require durable and comfortable blood drawing chairs.
The U.S. blood drawing chairs market generated USD 54.4 million in 2024, with demand surging in homecare settings where in-home phlebotomy services and mobile blood collection units are becoming increasingly popular. As more patients opt for at-home healthcare solutions, the need for portable, cushioned, and easy-to-use chairs that ensure patient safety and convenience during home visits is on the rise.
Table of Contents
Chapter 1 Methodology and Scope
- 1.1 Market scope and definitions
- 1.2 Research design
- 1.2.1 Research approach
- 1.2.2 Data collection methods
- 1.3 Base estimates and calculations
- 1.3.1 Base year calculation
- 1.3.2 Key trends for market estimation
- 1.4 Forecast model
- 1.5 Primary research and validation
- 1.5.1 Primary sources
- 1.5.2 Data mining sources
Chapter 2 Executive Summary
- 2.1 Industry 360° synopsis
Chapter 3 Industry Insights
- 3.1 Industry ecosystem analysis
- 3.2 Industry impact forces
- 3.2.1 Growth drivers
- 3.2.1.1 Growing need for blood and blood-related products
- 3.2.1.2 Rising prevalence of blood-related disorders
- 3.2.1.3 Increasing awareness towards blood donation
- 3.2.1.4 Growing diagnostic testing and laboratory services
- 3.2.2 Industry pitfalls & challenges
- 3.2.2.1 High cost of advanced blood drawing chairs
- 3.2.1 Growth drivers
- 3.3 Growth potential analysis
- 3.4 Future market trends
- 3.5 Technological landscape
- 3.6 Pricing analysis
- 3.7 Porter's analysis
- 3.8 PESTEL analysis
- 3.9 Value chain analysis
- 3.10 Gap analysis
Chapter 4 Competitive Landscape, 2024
- 4.1 Introduction
- 4.2 Company matrix analysis
- 4.3 Company market share analysis
- 4.4 Competitive analysis of major market players
- 4.5 Competitive positioning matrix
- 4.6 Strategy dashboard
Chapter 5 Market Estimates and Forecast, By Product, 2021-2034 ($ Mn)
- 5.1 Key trends
- 5.2 Manual chairs
- 5.3 Powered chairs
Chapter 6 Market Estimates and Forecast, By Type, 2021-2034 ($ Mn)
- 6.1 Key trends
- 6.2 Standard chairs
- 6.2.1 Adjustable
- 6.2.2 Non-adjustable
- 6.3 Recliner chairs
Chapter 7 Market Estimates and Forecast, By End Use, 2021-2034 ($ Mn)
- 7.1 Key trends
- 7.2 Hospitals
- 7.3 Blood donation centers
- 7.4 Diagnostic laboratories
- 7.5 Ambulatory surgical centers
- 7.6 Other end use
Chapter 8 Market Estimates and Forecast, By Region, 2021-2034 ($ Mn)
- 8.1 Key trends
- 8.2 North America
- 8.2.1 U.S.
- 8.2.2 Canada
- 8.3 Europe
- 8.3.1 Germany
- 8.3.2 UK
- 8.3.3 France
- 8.3.4 Italy
- 8.3.5 Spain
- 8.3.6 Netherlands
- 8.3.7 Rest of Europe
- 8.4 Asia Pacific
- 8.4.1 China
- 8.4.2 Japan
- 8.4.3 India
- 8.4.4 Australia
- 8.4.5 South Korea
- 8.4.6 Rest of Asia Pacific
- 8.5 Latin America
- 8.5.1 Brazil
- 8.5.2 Mexico
- 8.5.3 Argentina
- 8.5.4 Rest of Latin America
- 8.6 Middle East & Africa
- 8.6.1 Saudi Arabia
- 8.6.2 South Africa
- 8.6.3 UAE
- 8.6.4 Rest of Middle East & Africa
Chapter 9 Company Profiles
- 9.1 Clinton Industries
- 9.2 The Brewer Company
- 9.3 DUKAL Corporation
- 9.4 Med Care Manufacturing
- 9.5 Zhangjiagang Medi Medical Equipment
- 9.6 VELA Medical
- 9.7 SEERS Medical
- 9.8 Plinth Medical
- 9.9 Promotal
- 9.10 Naugra Medical
- 9.11 Remi Lab World

