
PUBLISHER: Global Market Insights Inc. | PRODUCT CODE: 1797762

PUBLISHER: Global Market Insights Inc. | PRODUCT CODE: 1797762
US E-Bike Market Opportunity, Growth Drivers, Industry Trend Analysis, and Forecast 2025 - 2034
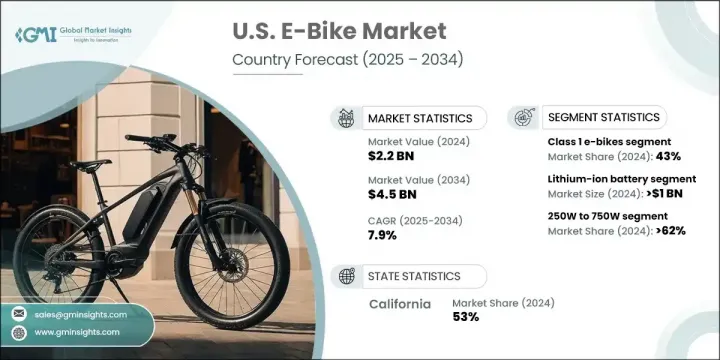
US E-Bike Market was valued at USD 2.2 billion in 2024 and is estimated to grow at a CAGR of 7.9% to reach USD 4.5 billion by 2034. This momentum is driven by various influential factors such as expanding urban development, rising interest in eco-friendly mobility, and an increasing focus on health and active lifestyles. Many US cities are gaining traction in e-bike usage thanks to enhanced bike-friendly infrastructure and environmentally conscious urban initiatives. Government-led efforts, including rebate incentives and financial support programs, are playing a pivotal role in boosting consumer adoption. These schemes are gaining popularity for both personal use and commercial fleet deployments, particularly in densely populated and suburban zones.
The pandemic also contributed to the shift, moving people away from public transit toward individualized and outdoor modes of transportation like e-bikes. With that behavioral change holding steady in the post-pandemic era, the industry has seen consistent demand for recreational and commuter use. Enhanced battery performance, lightweight frames, and integrated tech features are all helping drive enthusiasm for e-bikes, making them a preferred choice for short-distance travel and daily commuting across diverse consumer segments.
| Market Scope | |
|---|---|
| Start Year | 2024 |
| Forecast Year | 2025-2034 |
| Start Value | $2.2 Billion |
| Forecast Value | $4.5 Billion |
| CAGR | 7.9% |
The lithium-ion battery segment held a 48% share and generated USD 1 billion in 2024. Lithium-ion batteries are dominating the battery space in electric bikes due to their superior energy storage, longer lifecycle, and fast-charging capability. A wide range of high-end and mid-range e-bike models across the country now use lithium-ion as the standard power source. These batteries are lightweight and can be easily incorporated into intelligent systems, making them ideal for use in both high-performance and commuter e-bikes. Their increasing integration in smart mobility applications has elevated their appeal among urban commuters and outdoor enthusiasts alike, particularly in the growing recreational and daily-use categories.
Electric bikes powered within the 250W to 750W range segment held 62% share in 2024 and is projected to grow at a CAGR of 7% through 2034. This power band offers the right mix of speed, torque, and regulatory compliance for everyday riders, making it a preferred option for a wide audience. These motors are frequently used in hybrid, city, and cruiser models due to their ability to deliver optimal performance for both new and seasoned users. E-bikes within this wattage class are well-suited for city commuting, suburban travel, and recreational riding, as they meet performance classifications that balance power with safety regulations in the US.
California E-Bike Market held a 53% share in 2024, generating USD 528.8 million. The state leads in electric bike adoption thanks to its supportive environmental regulations, commitment to clean mobility, and proactive transportation policies. It also benefits from a high concentration of urban centers, where dense traffic and rising fuel costs are pushing residents to seek smarter alternatives. Through initiatives that promote micromobility adoption and financial support programs, California has created a favorable climate for electric bike growth. Urban areas across the state are experiencing a shift in commuter preferences, as people turn to e-bikes to reduce their carbon footprint and escape high auto-related expenses.
Firms such as Ride1UP, Rad Power Bikes, Cannondale, Aventon Bikes, Juiced Bikes, Trek Bicycle, and Lectric eBikes have maintained their edge through innovative product offerings, expanded distribution, and competitive pricing strategies. These brands continue to set benchmarks in quality, performance, and user experience, helping drive consumer trust and brand loyalty. Many leading brands are investing in R&D to develop lighter frames, enhance battery efficiency, and integrate IoT-enabled systems such as GPS tracking and mobile app connectivity. Several companies have expanded their presence through e-commerce platforms and exclusive retail stores, making their products more accessible across states. Strategic partnerships with logistics companies, municipalities, and micromobility service providers are also helping boost fleet sales.
Table of Contents
Chapter 1 Methodology
- 1.1 Market scope and definition
- 1.2 Research design
- 1.2.1 Research approach
- 1.2.2 Data collection methods
- 1.3 Data mining sources
- 1.3.1 Regional/Country
- 1.4 Base estimates and calculations
- 1.4.1 Base year calculation
- 1.4.2 Key trends for market estimation
- 1.5 Primary research and validation
- 1.5.1 Primary sources
- 1.6 Forecast model
- 1.7 Research assumptions and limitations
Chapter 2 Executive Summary
- 2.1 Industry 3600 synopsis, 2021 - 2034
- 2.2 Key market trends
- 2.2.1 Regional
- 2.2.2 Product
- 2.2.3 Battery
- 2.2.4 Motor
- 2.2.5 Propulsion
- 2.2.6 Ownership
- 2.2.7 Power output
- 2.2.8 Application
- 2.2.9 Sales channel
- 2.2.10 Price range
- 2.3 TAM Analysis, 2025-2034
- 2.4 CXO perspectives: Strategic imperatives
- 2.4.1 Executive decision points
- 2.4.2 Critical success factors
- 2.5 Future outlook and strategic recommendations
Chapter 3 Industry Insights
- 3.1 Industry ecosystem analysis
- 3.1.1 Supplier landscape
- 3.1.2 Profit margin analysis
- 3.1.3 Cost structure
- 3.1.4 Value addition at each stage
- 3.1.5 Factor affecting the value chain
- 3.1.6 Disruptions
- 3.2 Industry impact forces
- 3.2.1 Growth drivers
- 3.2.1.1 Increasing urban population and traffic congestion
- 3.2.1.2 Federal and state-level incentives
- 3.2.1.3 Rising fuel prices and sustainability awareness
- 3.2.1.4 Rise in health and fitness awareness
- 3.2.2 Industry pitfalls and challenges
- 3.2.2.1 High initial purchase costs
- 3.2.2.2 Limited charging infrastructure
- 3.2.3 Market opportunities
- 3.2.3.1 Last-mile delivery solutions
- 3.2.3.2 Corporate and employer programs
- 3.2.3.3 Tourism and recreation markets
- 3.2.3.4 Aging population mobility solutions
- 3.2.1 Growth drivers
- 3.3 Growth potential analysis
- 3.4 Regulatory landscape
- 3.4.1 US
- 3.4.1.1 Federal Regulations and Standards
- 3.4.1.2 State-Level Legislation Variations
- 3.4.1.3 Local Municipality Regulations
- 3.4.1.4 Safety and Performance Standards
- 3.4.1 US
- 3.5 Consumer behavior and adoption patterns
- 3.5.1 Consumer demographics analysis
- 3.5.1.1 Age group segmentation
- 3.5.1.2 Income level correlations
- 3.5.1.3 Geographic distribution patterns
- 3.5.1.4 Gender-based usage preferences
- 3.5.2 Purchase decision factors
- 3.5.2.1 Price sensitivity analysis
- 3.5.2.2 Brand preference and loyalty
- 3.5.2.3 Feature importance rankings
- 3.5.2.4 Quality and reliability expectations
- 3.5.3 Usage patterns and applications
- 3.5.3.1 Commuting and transportation
- 3.5.3.2 Recreation and leisure
- 3.5.3.3 Fitness and health applications
- 3.5.3.4 Commercial and delivery use
- 3.5.4 Regional consumer variations
- 3.5.4.1 West Coast early adopters
- 3.5.4.2 East Coast urban commuters
- 3.5.4.3 Midwest recreational users
- 3.5.4.4 Southern region emerging markets
- 3.5.5 Consumer challenges and barriers
- 3.5.5.1 Cost and affordability concerns
- 3.5.5.2 Safety and security issues
- 3.5.5.3 Infrastructure limitations
- 3.5.5.4 Maintenance and service concerns
- 3.5.1 Consumer demographics analysis
- 3.6 Porter's analysis
- 3.7 PESTEL analysis
- 3.8 Technology and innovation landscape
- 3.8.1 Current technological trends
- 3.8.1.1 Direct TPMS sensor evolution
- 3.8.1.2 Indirect TPMS software advancement
- 3.8.1.3 Wireless communication technologies
- 3.8.2 Emerging technologies
- 3.8.2.1 IoT and connected TPMS
- 3.8.2.2 AI and machine learning integration
- 3.8.2.3 Advanced sensor fusion
- 3.8.2.4 Predictive maintenance capabilities
- 3.8.1 Current technological trends
- 3.9 Price trends
- 3.9.1 By region
- 3.9.2 By Product
- 3.10 Production statistics
- 3.10.1 Production hubs
- 3.10.2 Consumption hubs
- 3.10.3 Export and import
- 3.11 Cost breakdown analysis
- 3.12 Patent analysis
- 3.13 Sustainability and environmental aspects
- 3.13.1 Sustainable practices
- 3.13.2 Waste reduction strategies
- 3.13.3 Energy efficiency in production
- 3.13.4 Eco-friendly initiatives
- 3.13.5 Carbon footprint considerations
- 3.13.6 Circular economy and recycling
- 3.14 Investment and funding landscape
- 3.14.1 Total investment volume and trends
- 3.14.2 Geographic investment distribution
- 3.15 Government and public funding
- 3.15.1 Federal research and development grants
- 3.15.2 State economic development programs
- 3.15.3 Infrastructure investment initiatives
- 3.15.4 Clean energy and transportation funding
- 3.16 Investment Opportunities and Risks
- 3.16.1 High-growth market segments
- 3.16.2 Emerging technology investment areas
- 3.16.3 Risk assessment and mitigation
- 3.16.4 ROI analysis and projections
Chapter 4 Competitive Landscape, 2024
- 4.1 Introduction
- 4.2 Company market share analysis
- 4.2.1 Northeast
- 4.2.2 West
- 4.2.3 South
- 4.2.4 Midwest
- 4.3 Competitive analysis of major market players
- 4.4 Competitive positioning matrix
- 4.5 Strategic outlook matrix
- 4.6 Key developments
- 4.6.1 Mergers & acquisitions
- 4.6.2 Partnerships & collaborations
- 4.6.3 New product launches
- 4.6.4 Expansion plans and funding
- 4.6.5 Technology licensing agreements
- 4.7 Go-to-market strategy analysis
- 4.7.1 Brand positioning and marketing
- 4.7.2 Customer acquisition strategies
- 4.7.3 Retail and distribution approaches
- 4.7.4 After-sales service and support
Chapter 5 Market Estimates & Forecast, By Product, 2021 - 2034 ($Bn, Units)
- 5.1 Class 1 e-bikes
- 5.2 Class 2 e-bikes
- 5.3 Class 3 e-bikes
- 5.4 Cargo e-bikes
- 5.5 Folding e-bikes
Chapter 6 Market Estimates & Forecast, By Battery, 2021 - 2034 ($Bn, Units)
- 6.1 Lithium-ion
- 6.2 Lithium polymer
- 6.3 Lead acid
- 6.4 Others
Chapter 7 Market Estimates & Forecast, By Motor, 2021 - 2034 ($Bn, Units)
- 7.1 Hub motors
- 7.2 Mid-drive motors
Chapter 8 Market Estimates & Forecast, By Propulsion, 2021 - 2034 ($Bn, Units)
- 8.1 Pedal assist
- 8.2 Throttle control
Chapter 9 Market Estimates & Forecast, By Ownership, 2021 - 2034 ($Bn, Units)
- 9.1 Shared
- 9.2 Personal
Chapter 10 Market Estimates & Forecast, By Power Output, 2021 - 2034 ($Bn, Units)
- 10.1 Below 250W
- 10.2 250W to 750W
- 10.3 Above 750W
Chapter 11 Market Estimates & Forecast, By Application, 2021 - 2034 ($Bn, Units)
- 11.1 Commuting and transportation
- 11.2 Recreation and leisure
- 11.3 Commercial and delivery
- 11.4 Cargo and utility
- 11.5 Others
Chapter 12 Market Estimates & Forecast, By Distribution Channel, 2021 - 2034 ($Bn, units)
- 12.1 Direct-to-consumer (D2C) sales
- 12.2 Independent bike dealers (IBD)
- 12.3 Sporting goods retailers
- 12.4 Big box retailers
- 12.5 Online marketplaces
Chapter 13 Market estimates & forecast, by Price Range, 2021 - 2034 ($Bn, Units)
- 13.1 Budget
- 13.2 Mid-Range
- 13.3 Premium
- 13.4 Luxury
Chapter 14 Market Estimates & Forecast, By Region, 2021 - 2034 ($Bn, units)
- 14.1 Key trends
- 14.2 Northeast US
- 14.2.1 Connecticut
- 14.2.2 Maine
- 14.2.3 Massachusetts
- 14.2.4 New Hampshire
- 14.2.5 New Jersey
- 14.2.6 New York
- 14.2.7 Pennsylvania
- 14.2.8 Rhode Island
- 14.2.9 Vermont
- 14.3 Midwest US
- 14.3.1 Illinois
- 14.3.2 Indiana
- 14.3.3 Iowa
- 14.3.4 Kansas
- 14.3.5 Michigan
- 14.3.6 Minnesota
- 14.3.7 Missouri
- 14.3.8 Nebraska
- 14.3.9 North Dakota
- 14.3.10 Ohio
- 14.3.11 South Dakota
- 14.3.12 Wisconsin
- 14.4 South US
- 14.4.1 Alabama
- 14.4.2 Arkansas
- 14.4.3 Delaware
- 14.4.4 Florida
- 14.4.5 Georgia
- 14.4.6 Kentucky
- 14.4.7 Louisiana
- 14.4.8 Maryland
- 14.4.9 Mississippi
- 14.4.10 North Carolina
- 14.4.11 Oklahoma
- 14.4.12 South Carolina
- 14.4.13 Tennessee
- 14.4.14 Texas
- 14.4.15 Virginia
- 14.4.16 West Virginia
- 14.4.17 Washington D.C.
- 14.5 West US
- 14.5.1 Alaska
- 14.5.2 Arizona
- 14.5.3 California
- 14.5.4 Colorado
- 14.5.5 Hawaii
- 14.5.6 Idaho
- 14.5.7 Montana
- 14.5.8 Nevada
- 14.5.9 New Mexico
- 14.5.10 Oregon
- 14.5.11 Utah
- 14.5.12 Washington
- 14.5.13 Wyoming
Chapter 15 Company Profiles
- 15.1 Leading E-bike manufacturers
- 15.1.1 Aventon Bikes
- 15.1.2 Cannondale
- 15.1.3 Giant Manufacturing Co.
- 15.1.4 Lectric eBikes
- 15.1.5 Magnum Bikes
- 15.1.6 Merida Industry
- 15.1.7 Pedego Electric Bikes
- 15.1.8 Rad Power Bikes
- 15.1.9 Riese & Muller
- 15.1.10 Trek Bicycle
- 15.1.11 Yadea Group
- 15.2 Emerging and Direct-to-Consumer Brands
- 15.2.1 Juiced Bikes
- 15.2.2 Ride1 UP
- 15.2.3 Super73
- 15.2.4 VanMoof
- 15.3 Component and technology suppliers
- 15.3.1 Bosch eBike Systems
- 15.3.2 Brose Drive Systems
- 15.3.3 Panasonic
- 15.3.4 Shimano
- 15.3.5 Yamaha Motor
- 15.4 Retail and distribution partners
- 15.4.1 Amazon and E-commerce Platforms
- 15.4.2 Dick's Sporting Goods
- 15.4.3 Local Bike Shop Networks
- 15.4.4 Performance Bicycle
- 15.4.5 REI Co-op

