
PUBLISHER: Global Market Insights Inc. | PRODUCT CODE: 1936624

PUBLISHER: Global Market Insights Inc. | PRODUCT CODE: 1936624
Chlorosilane Market Opportunity, Growth Drivers, Industry Trend Analysis, and Forecast 2026 - 2035
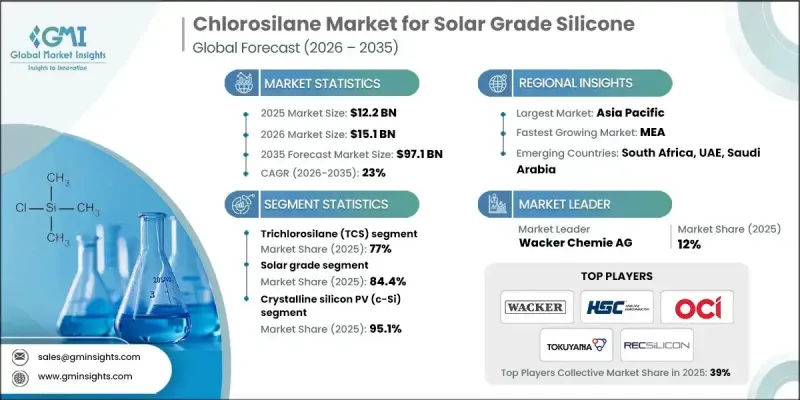
The Global Chlorosilane Market for Solar Grade Silicone was valued at USD 12.2 billion in 2025 and is estimated to grow at a CAGR of 23% to reach USD 97.1 billion by 2035.
Market growth is driven by the critical role chlorosilanes play as intermediates in the production of ultra-high-purity silicon and silicone used in solar-grade applications. Between 2021 and 2025, demand for silicone was largely met through localized supply as photovoltaic manufacturing capacity expanded and supply chains became more regionally integrated. During this period, photovoltaic material chemistry remained largely stable, while manufacturing efficiency improved through technology optimization. Advancements in polysilicon and PV production have increased purity requirements, leading manufacturers to adopt tighter chlorosilane processing standards. These improvements have resulted in better material consistency, higher yields, and improved cell efficiency. At the same time, energy security concerns and policy initiatives are accelerating the development of integrated solar manufacturing ecosystems. Regions are increasingly co-locating chlorosilane, polysilicon, ingot, and module production to reduce reliance on cross-border supply chains and improve long-term supply stability.
| Market Scope | |
|---|---|
| Start Year | 2025 |
| Forecast Year | 2026-2035 |
| Start Value | $12.2 Billion |
| Forecast Value | $97.1 Billion |
| CAGR | 23% |
The solar grade products segment accounted for 84.4% share in 2025 and is expected to grow at a CAGR of 22.6% from 2026 to 2035. Higher-purity solar and electronic grades command premium pricing due to stricter specifications, while industrial-grade materials remain driven by volume demand. As photovoltaic and semiconductor technologies advance, buyers are applying greater scrutiny to impurity control, reinforcing long-term supply agreements and qualification processes that favor established manufacturers with proven reliability.
The crystalline silicon photovoltaic technology segment held 95.1% share in 2025 and is projected to grow at a CAGR of 22.8% through 2035. Market demand continues to shift toward monocrystalline silicon, which has become the preferred standard due to performance and cost advantages. This transition is increasing the need for higher-purity chlorosilane inputs and stricter process control. Demand from thin-film photovoltaic technologies remains minimal, keeping chlorosilane consumption closely tied to crystalline silicon capacity expansion and efficiency improvements.
North America Chlorosilane Market for Solar Grade Silicone reached USD 864 million in 2025. Regional growth is supported by advanced photovoltaic deployments, ongoing technology upgrades, strong research capabilities, and supportive policy frameworks. A well-established base of integrated polysilicon producers continues to ensure stable chlorosilane demand while improving material recycling economics and operational efficiency.
Key participants operating in the Global Chlorosilane Market for Solar Grade Silicone include Shin-Etsu Chemical Co., Ltd., Wacker Chemie AG, Dow, Hemlock Semiconductor (HSC), Tokuyama Corporation, Momentive, OCI Company Ltd., REC Silicon ASA, Evonik Industries AG, Mitsubishi Chemical Group, Gelest, Inc., and Rohm and Haas Electronic Materials (Dow). Companies in the Chlorosilane Market for Solar Grade Silicone are strengthening their market position by investing in advanced purification technologies and tighter process control to meet rising purity requirements. Firms are expanding regional production capacity to support localized solar manufacturing ecosystems and reduce supply chain risks. Long-term supply agreements with photovoltaic and polysilicon manufacturers are being prioritized to secure stable demand. Players are also focusing on operational efficiency, recycling optimization, and yield improvement to enhance margins. Strategic collaborations with downstream partners, along with continuous R&D investment, are enabling manufacturers to align with evolving photovoltaic technologies while maintaining cost competitiveness and regulatory compliance across global markets.
Table of Contents
Chapter 1 Methodology & Scope
- 1.1 Market scope and definition
- 1.2 Research design
- 1.2.1 Research approach
- 1.2.2 Data collection methods
- 1.3 Data mining sources
- 1.3.1 Global
- 1.3.2 Regional/Country
- 1.4 Base estimates and calculations
- 1.4.1 Base year calculation
- 1.4.2 Key trends for market estimation
- 1.5 Primary research and validation
- 1.5.1 Primary sources
- 1.6 Forecast model
- 1.7 Research assumptions and limitations
Chapter 2 Executive Summary
- 2.1 Industry 360° synopsis
- 2.2 Key market trends
- 2.2.1 Regional
- 2.2.2 Product type
- 2.2.3 Purity grade
- 2.2.4 End Use
- 2.3 TAM Analysis, 2026-2035
- 2.4 CXO perspectives: Strategic imperatives
- 2.4.1 Executive decision points
- 2.4.2 Critical success factors
- 2.5 Future Outlook and Strategic Recommendations
Chapter 3 Industry Insights
- 3.1 Industry ecosystem analysis
- 3.1.1 Supplier landscape
- 3.1.2 Profit margin
- 3.1.3 Value addition at each stage
- 3.1.4 Factor affecting the value chain
- 3.1.5 Disruptions
- 3.2 Industry impact forces
- 3.2.1 Growth drivers
- 3.2.1.1 Rapid solar PV capacity additions
- 3.2.1.2 Rising decarbonization and net-zero commitments
- 3.2.1.3 Advances in high-efficiency cell technologies
- 3.2.2 Industry pitfalls and challenges
- 3.2.2.1 High capital and operational intensity
- 3.2.2.2 Stringent environmental and safety regulations
- 3.2.3 Market opportunities
- 3.2.3.1 Expansion of polysilicon recycling and upgrading
- 3.2.3.2 Emerging markets building domestic PV manufacturing
- 3.2.1 Growth drivers
- 3.3 Growth potential analysis
- 3.4 Regulatory landscape
- 3.4.1 North America
- 3.4.2 Europe
- 3.4.3 Asia Pacific
- 3.4.4 Latin America
- 3.4.5 Middle East & Africa
- 3.5 Porter's analysis
- 3.6 PESTEL analysis
- 3.7 Price trends
- 3.7.1 By region
- 3.7.2 By Product type
- 3.8 Future market trends
- 3.9 Technology and Innovation landscape
- 3.9.1 Current technological trends
- 3.9.2 Emerging technologies
- 3.10 Patent Landscape
- 3.11 Trade statistics (HS code) ( Note: the trade statistics will be provided for key countries only)
- 3.11.1 Major importing countries
- 3.11.2 Major exporting countries
- 3.12 Sustainability and environmental aspects
- 3.12.1 Sustainable practices
- 3.12.2 Waste reduction strategies
- 3.12.3 Energy efficiency in production
- 3.12.4 Eco-friendly initiatives
- 3.13 Carbon footprint consideration
Chapter 4 Competitive Landscape, 2025
- 4.1 Introduction
- 4.2 Company market share analysis
- 4.2.1 By region
- 4.2.1.1 North America
- 4.2.1.2 Europe
- 4.2.1.3 Asia Pacific
- 4.2.1.4 LATAM
- 4.2.1.5 MEA
- 4.2.1 By region
- 4.3 Company matrix analysis
- 4.4 Competitive analysis of major market players
- 4.5 Competitive positioning matrix
- 4.6 Key developments
- 4.6.1 Mergers & acquisitions
- 4.6.2 Partnerships & collaborations
- 4.6.3 New Product Launches
- 4.6.4 Expansion Plans
Chapter 5 Market Estimates and Forecast, By Product Type, 2022-2035 (USD Billion) (Kilo Tons)
- 5.1 Key trends
- 5.2 Trichlorosilane (TCS)
- 5.3 Dichlorosilane (DCS)
- 5.4 Tetrachlorosilane (STC)
- 5.5 Monochlorosilane (MCS)
- 5.6 Other chlorosilanes
Chapter 6 Market Estimates and Forecast, By Purity Grade, 2022-2035 (USD Billion) (Kilo Tons)
- 6.1 Key trends
- 6.2 Solar grade
- 6.3 Electronic grade
- 6.4 Industrial grade
Chapter 7 Market Estimates and Forecast, By End Use, 2022-2035 (USD Billion) (Kilo Tons)
- 7.1 Key trends
- 7.2 Crystalline silicon PV (c-Si)
- 7.2.1 Mono c-Si
- 7.2.2 Multi c-Si
- 7.3 Thin-film PV (limited relevance for solar-grade polysilicon chain)
- 7.4 Solar components and balance-of-system using silicones
- 7.4.1 Modules (lamination, junction box sealing)
- 7.4.2 Inverters and power electronics (potting, TIMs)
- 7.4.3 Mounting systems and trackers (sealants, coatings)
Chapter 8 Market Estimates and Forecast, By Region, 2022-2035 (USD Billion) (Kilo Tons)
- 8.1 Key trends
- 8.2 North America
- 8.2.1 U.S.
- 8.2.2 Canada
- 8.3 Europe
- 8.3.1 Germany
- 8.3.2 UK
- 8.3.3 France
- 8.3.4 Spain
- 8.3.5 Italy
- 8.3.6 Rest of Europe
- 8.4 Asia Pacific
- 8.4.1 China
- 8.4.2 India
- 8.4.3 Japan
- 8.4.4 Australia
- 8.4.5 South Korea
- 8.4.6 Rest of Asia Pacific
- 8.5 Latin America
- 8.5.1 Brazil
- 8.5.2 Mexico
- 8.5.3 Argentina
- 8.5.4 Rest of Latin America
- 8.6 Middle East and Africa
- 8.6.1 Saudi Arabia
- 8.6.2 South Africa
- 8.6.3 UAE
- 8.6.4 Rest of Middle East and Africa
Chapter 9 Company Profiles
- 9.1 Wacker Chemie AG
- 9.2 Hemlock Semiconductor (HSC)
- 9.3 OCI Company Ltd.
- 9.4 Tokuyama Corporation
- 9.5 REC Silicon ASA
- 9.6 Evonik Industries AG
- 9.7 Dow
- 9.8 Momentive
- 9.9 Shin-Etsu Chemical Co., Ltd.
- 9.10 RoHM and Haas Electronic Materials (Dow)
- 9.11 Mitsubishi Chemical Group
- 9.12 Gelest, Inc.

