
PUBLISHER: Global Market Insights Inc. | PRODUCT CODE: 1936674

PUBLISHER: Global Market Insights Inc. | PRODUCT CODE: 1936674
Ethanolamines Market Opportunity, Growth Drivers, Industry Trend Analysis, and Forecast 2026 - 2035
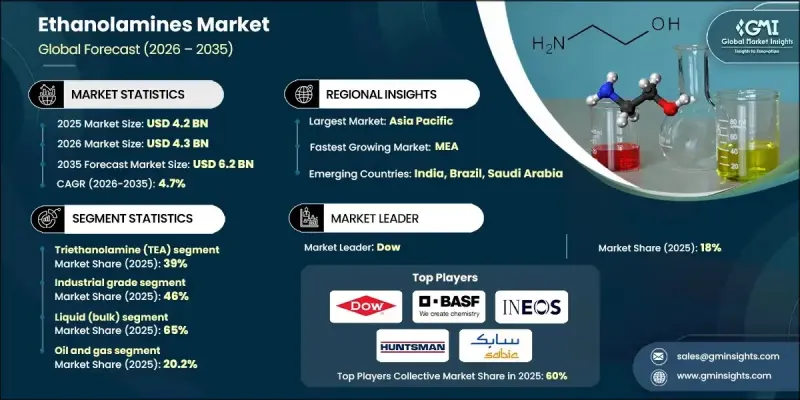
The Global Ethanolamines Market was valued at USD 4.2 billion in 2025 and is estimated to grow at a CAGR of 4.7% to reach USD 6.2 billion by 2035.
Over the past four years, demand has steadily increased due to the post-pandemic rise in construction chemicals, detergents, and gas treatment applications. Global chemical production expanded between 2021 and 2025, with organizations like the International Energy Agency highlighting strong growth in the consumption of cleaning chemicals, which constitute the primary markets for monoethanolamine (MEA), diethanolamine (DEA), and triethanolamine (TEA). The consistent rise in chemical manufacturing has largely been driven by the production of surfactants and detergents. Pandemic-related surges in hygiene and cleaning product demand persisted into the post-pandemic period, maintaining high consumption levels. Ethanolamines are essential ingredients in creating non-ionic and anionic surfactants, which are widely used in industrial and institutional cleaning solutions, personal care formulations, and other cleaning products. Rapid industrial growth in countries such as China, India, and across Southeast Asia has fueled expansion in downstream applications like fertilizers, cement, coatings, and cleaning products, making the Asia Pacific region the largest and fastest-growing ethanolamines market. Meanwhile, North America and Europe experienced steady, efficiency-driven growth due to moderate environmental regulations and energy-transition policies. In industries such as oil and gas, construction, and industrial cleaning, specialized ethanolamine-based gas treatment solutions were used, but these sectors contributed modestly to overall market growth, leaving certain market gaps.
| Market Scope | |
|---|---|
| Start Year | 2025 |
| Forecast Year | 2026-2035 |
| Start Value | $4.2 Billion |
| Forecast Value | $6.2 Billion |
| CAGR | 4.7% |
The triethanolamine (TEA) segment accounted for 39% share and is expected to grow at a CAGR of 4.3% by 2035. The ethanolamines market is gradually shifting from a volume-driven, commodity-based model to a more targeted approach with defined product roles. MEA continues to be indispensable in gas treatment and agricultural chemicals, while DEA and TEA are critical for surfactants, detergents, and personal care applications. TEA is particularly versatile, serving as a neutralizer, emulsifier, and pH adjuster in a wide range of formulations, making it a multifunctional component for numerous chemical processes.
The liquid (bulk) segment held 65% share and is projected to grow at a CAGR of 4.6% by 2035. Bulk liquid ethanolamines serve multiple industries, including gas treatment, detergents, agricultural chemicals, and cement additives. Logistics solutions such as pipelines, bulk trucks, and ISO tanks help optimize costs for large-scale consumers. Many producers are now providing ethanolamines as aqueous blends or solutions, which simplifies on-site handling, improves dosing efficiency, and ensures compliance with safety standards for industrial plants, refineries, and large integrators.
North America Ethanolamines Market reached USD 921 million in 2025 and is expected to grow to USD 1.3 billion by 2035. The growth is primarily driven by gas treatment, detergents, and downstream chemical applications. The region benefits from mature gas processing infrastructure, established industrial and household cleaning markets, and stringent product-performance regulations, which sustain steady demand for MEA, DEA, and TEA.
Key players in the Global Ethanolamines Market include BASF SE, Dow, INEOS Group, Huntsman Corporation, SABIC, Eastman Chemical Company, Nippon Shokubai Co., Ltd., LyondellBasell Industries, Reliance Industries Limited, India Glycols Limited, Sinopec, Mitsubishi Chemical Corporation, PCC Rokita SA, Saudi Kayan Petrochemical Company, Thai Ethanolamines Co., Ltd., and Aceto GmbH. Companies in the ethanolamines market are adopting several strategic measures to strengthen their position and expand market reach. These include forming partnerships and alliances with chemical and industrial manufacturers to enhance product integration, investing heavily in research and development for next-generation ethanolamine products, and improving production efficiencies to reduce costs. Firms are also focusing on regional expansion in high-growth markets, acquiring smaller specialty chemical companies, and offering tailored, high-performance solutions for specific applications.
Table of Contents
Chapter 1 Methodology & Scope
- 1.1 Market scope and definition
- 1.2 Research design
- 1.2.1 Research approach
- 1.2.2 Data collection methods
- 1.3 Data mining sources
- 1.3.1 Global
- 1.3.2 Regional/Country
- 1.4 Base estimates and calculations
- 1.4.1 Base year calculation
- 1.4.2 Key trends for market estimation
- 1.5 Primary research and validation
- 1.5.1 Primary sources
- 1.6 Forecast model
- 1.7 Research assumptions and limitations
Chapter 2 Executive Summary
- 2.1 Industry 3600 synopsis
- 2.2 Key market trends
- 2.2.1 Regional
- 2.2.2 Product Type
- 2.2.3 Grade
- 2.2.4 Form
- 2.2.5 End Use
- 2.3 TAM Analysis, 2026-2035
- 2.4 CXO perspectives: Strategic imperatives
- 2.4.1 Executive decision points
- 2.4.2 Critical success factors
- 2.5 Future Outlook and Strategic Recommendations
Chapter 3 Industry Insights
- 3.1 Industry ecosystem analysis
- 3.1.1 Supplier landscape
- 3.1.2 Profit margin
- 3.1.3 Value addition at each stage
- 3.1.4 Factor affecting the value chain
- 3.1.5 Disruptions
- 3.2 Industry impact forces
- 3.2.1 Growth drivers
- 3.2.1.1 Growing gas treating demand in natural gas processing
- 3.2.1.2 Rising surfactant use in cleaning and personal care
- 3.2.1.3 Infrastructure and construction growth in Asia Pacific
- 3.2.2 Industry pitfalls and challenges
- 3.2.2.1 Volatile ethylene and ammonia feedstock prices
- 3.2.2.2 Environmental and health concerns around DEA usage
- 3.2.3 Market opportunities
- 3.2.3.1 Expansion of gas projects in Middle East and Asia
- 3.2.3.2 Development of bio-based and low-VOC formulations
- 3.2.1 Growth drivers
- 3.3 Growth potential analysis
- 3.4 Regulatory landscape
- 3.4.1 North America
- 3.4.2 Europe
- 3.4.3 Asia Pacific
- 3.4.4 Latin America
- 3.4.5 Middle East & Africa
- 3.5 Porter's analysis
- 3.6 PESTEL analysis
- 3.7 Price trends
- 3.7.1 By region
- 3.7.2 By Product type
- 3.8 Future market trends
- 3.9 Technology and Innovation landscape
- 3.9.1 Current technological trends
- 3.9.2 Emerging technologies
- 3.10 Patent Landscape
- 3.11 Trade statistics (HS code) ( Note: the trade statistics will be provided for key countries only)
- 3.11.1 Major importing countries
- 3.11.2 Major exporting countries
- 3.12 Sustainability and environmental aspects
- 3.12.1 Sustainable practices
- 3.12.2 Waste reduction strategies
- 3.12.3 Energy efficiency in production
- 3.12.4 Eco-friendly initiatives
- 3.13 Carbon footprint consideration
Chapter 4 Competitive Landscape, 2025
- 4.1 Introduction
- 4.2 Company market share analysis
- 4.2.1 By region
- 4.2.1.1 North America
- 4.2.1.2 Europe
- 4.2.1.3 Asia Pacific
- 4.2.1.4 LATAM
- 4.2.1.5 MEA
- 4.2.1 By region
- 4.3 Company matrix analysis
- 4.4 Competitive analysis of major market players
- 4.5 Competitive positioning matrix
- 4.6 Key developments
- 4.6.1 Mergers & acquisitions
- 4.6.2 Partnerships & collaborations
- 4.6.3 New Product Launches
- 4.6.4 Expansion Plans
Chapter 5 Market Estimates and Forecast, By Product Type, 2022-2035 (USD Billion) (Kilo Tons)
- 5.1 Key trends
- 5.2 Monoethanolamine (MEA)
- 5.3 Diethanolamine (DEA)
- 5.4 Triethanolamine (TEA)
- 5.5 Other ethanolamine derivatives
Chapter 6 Market Estimates and Forecast, By Grade, 2022-2035 (USD Billion) (Kilo Tons)
- 6.1 Key trends
- 6.2 Technical grade
- 6.3 Industrial grade
- 6.4 High-purity grade
- 6.5 Specialty / customized formulations
Chapter 7 Market Estimates and Forecast, By Form, 2022-2035 (USD Billion) (Kilo Tons)
- 7.1 Key trends
- 7.2 Liquid (bulk)
- 7.3 Solution / aqueous blends
- 7.4 Solid / flakes (where applicable)
Chapter 8 Market Estimates and Forecast, By End Use, 2022-2035 (USD Billion) (Kilo Tons)
- 8.1 Key trends
- 8.2 Oil and gas
- 8.3 Chemicals and petrochemicals
- 8.4 Home and industrial cleaning
- 8.5 Personal care and cosmetics
- 8.6 Agriculture
- 8.7 Metalworking and automotive
- 8.8 Pharmaceuticals and healthcare
- 8.9 Paper and pulp
- 8.10 Other industrial and specialty end uses
Chapter 9 Market Estimates and Forecast, By Region, 2022-2035 (USD Billion) (Kilo Tons)
- 9.1 Key trends
- 9.2 North America
- 9.2.1 U.S.
- 9.2.2 Canada
- 9.3 Europe
- 9.3.1 Germany
- 9.3.2 UK
- 9.3.3 France
- 9.3.4 Spain
- 9.3.5 Italy
- 9.3.6 Rest of Europe
- 9.4 Asia Pacific
- 9.4.1 China
- 9.4.2 India
- 9.4.3 Japan
- 9.4.4 Australia
- 9.4.5 South Korea
- 9.4.6 Rest of Asia Pacific
- 9.5 Latin America
- 9.5.1 Brazil
- 9.5.2 Mexico
- 9.5.3 Argentina
- 9.5.4 Rest of Latin America
- 9.6 Middle East and Africa
- 9.6.1 Saudi Arabia
- 9.6.2 South Africa
- 9.6.3 UAE
- 9.6.4 Rest of Middle East and Africa
Chapter 10 Company Profiles
- 10.1 Dow
- 10.2 BASF SE
- 10.3 INEOS Group
- 10.4 Huntsman Corporation
- 10.5 SABIC
- 10.6 Eastman Chemical Company
- 10.7 Nippon Shokubai Co., Ltd.
- 10.8 LyondellBasell Industries
- 10.9 India Glycols Limited
- 10.10 Reliance Industries Limited
- 10.11 Sinopec
- 10.12 Mitsubishi Chemical Corporation
- 10.13 PCC Rokita SA
- 10.14 Saudi Kayan Petrochemical Company
- 10.15 Thai Ethanolamines Co., Ltd.
- 10.16 Aceto GmbH

