
PUBLISHER: MarketsandMarkets | PRODUCT CODE: 1800735

PUBLISHER: MarketsandMarkets | PRODUCT CODE: 1800735
E-fuels Market by Type, State, End Use, Application and Region - Global Forecast to 2030
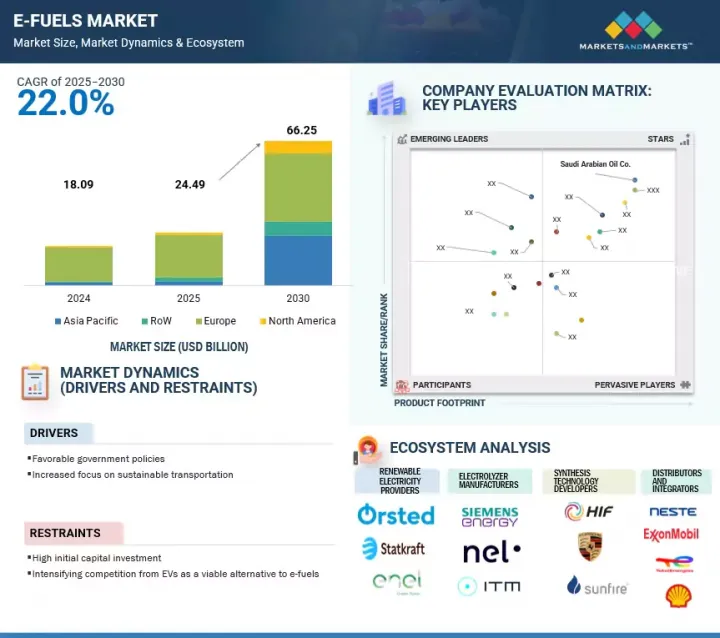
The e-fuels market is estimated to reach USD 66.25 billion by 2030 from USD 24.49 billion in 2025, at a CAGR of 22.0% during the forecast period. The e-fuels market is driven by the global push for decarbonization in sectors where direct electrification is challenging, such as aviation, maritime, and heavy transport. Rising carbon regulations, renewable fuel mandates, and government incentives are accelerating adoption.
| Scope of the Report | |
|---|---|
| Years Considered for the Study | 2020-2030 |
| Base Year | 2024 |
| Forecast Period | 2025-2030 |
| Units Considered | Value (USD Million/Billion); Volume (Liters) |
| Segments | Type, State, End-use, Application, Renewable sources, and Region |
| Regions covered | North America, Europe, Asia Pacific, and the Rest of the World |
Technological advancements in green hydrogen, carbon capture, and Power-to-Liquid processes enhance efficiency and scalability. The ability of e-fuels to integrate with existing fuel infrastructure makes them an attractive transitional solution. Increasing energy security concerns and corporate sustainability commitments also further propel demand for low-carbon, synthetic fuels worldwide.
"By fuel type, e-ammonia is projected to be the most lucrative segment of the e-fuels market during the forecast period."
E-ammonia is the largest segment of the e-fuels market by fuel type, driven by its high hydrogen content, carbon-free combustion, and diverse application potential. It is increasingly favored as a clean fuel for the maritime industry, offering a viable alternative to heavy fuel oil without producing CO2 emissions during use. E-ammonia is also gaining traction as a hydrogen carrier in power generation due to its ease of storage and transport. Growing investments in green ammonia production using renewable hydrogen and nitrogen are enhancing scalability. Additionally, countries and companies are aligning with global decarbonization goals, leading to increased R&D and pilot projects. Supportive government policies and regulatory incentives targeting net-zero emissions are further driving demand. Its dual role as both a fuel and feedstock strengthens its market position across energy and industrial sectors.
"By state, the liquid segment is expected to remain the largest segment throughout the forecast period."
The liquid segment is expected to remain the largest segment by state in the e-fuels market, primarily due to its compatibility with existing fuel infrastructure and widespread use across key industries. Liquid e-fuels such as e-diesel, e-gasoline, e-kerosene, and e-methanol can be easily stored, transported, and distributed using current pipelines, tanks, and refueling stations, reducing the need for major infrastructure overhauls. Their ability to serve as drop-in replacements for conventional fuels makes them ideal for aviation, maritime, and road transport applications. Additionally, ongoing advancements in Power-to-Liquid technologies and increasing investments in commercial-scale production facilities are enhancing their market readiness. Strong policy support for low-carbon liquid fuels, especially in the transport sector, further strengthens the liquid segment's leading position in the e-fuels market during the forecast period.
"By region, Asia Pacific is expected to be the second-largest region in the e-fuels market during the forecast period."
Asia Pacific is expected to be the second-largest region in the e-fuels market, driven by rapid industrialization, growing energy demand, and strong government initiatives supporting clean energy transitions. The region's focus on energy security and reducing reliance on imported fossil fuels is accelerating the development of domestic e-fuel projects. Additionally, a strong interest in decarbonizing hard-to-abate sectors like shipping, aviation, and chemicals is fueling demand. Supportive policy frameworks, public-private partnerships, and rising investment in renewable infrastructure further position Asia Pacific as a key player in the global e-fuels landscape during the forecast period. Moreover, Asia Pacific's industrial and chemical sectors are driving demand for e-fuels, especially e-methanol and e-ammonia, as low-carbon feedstocks. China and India, with large-scale chemical manufacturing capacities, are exploring green alternatives to reduce carbon intensity.
Breakdown of Primaries:
In-depth interviews have been conducted with various key industry participants, subject-matter experts, C-level executives of key market players, and industry consultants, among other experts, to obtain and verify critical qualitative and quantitative information and assess future market prospects. The distribution of primary interviews is as follows:
By Company Type: Tier 1- 65%, Tier 2- 24%, and Tier 3- 11%
By Designation: C-Level Executives - 30%, Managers- 25%, and Others- 45%
By Region: North America- 30%, Europe- 35%, Asia Pacific- 25%, and RoW- 10%
Note: Others include product engineers, product specialists, and engineering leads.
Note: The tiers of the companies are defined based on their total revenues as of 2023. Tier 1: > USD 1 billion, Tier 2: From USD 500 million to USD 1 billion, and Tier 3: < USD 500 million
The e-fuels market is dominated by a few major players that have a wide regional presence. The leading players in the e-fuels market are Saudi Arabian Oil Co. (Saudi Arabia), AUDI AG (Germany), Repsol (Spain), Sunfire SE (Germany), Electrochaea GmbH (Germany), Uniper SE (Germany), Orsted A/S (Denmark), Yara (Norway), Perstorp (Germany), HIF Global (US), INFINIUM (US), among others.
Study Coverage:
The report defines, describes, and forecasts the e-fuel market by size, application, and fuel type. It also offers a detailed qualitative and quantitative analysis of the market. The report provides a comprehensive review of the major market drivers, restraints, opportunities, and challenges. It also covers various important aspects of the market. These include an analysis of the competitive landscape, market dynamics, market estimates in terms of value, and future trends in the e-fuels market.
Key Benefits of Buying the Report
- The e-fuels market is driven by the global shift toward decarbonization and sustainable energy solutions, particularly in sectors where direct electrification is challenging. With increasing concerns over climate change, carbon emissions, and fossil fuel dependency, e-fuels offer a carbon-neutral alternative by utilizing renewable hydrogen and captured CO2 to create synthetic fuels compatible with existing infrastructure. Their drop-in compatibility with conventional engines and fuel systems makes them ideal for hard-to-abate sectors such as aviation, shipping, heavy transport, and chemicals. As nations set ambitious net-zero targets, the demand for scalable, low-carbon liquid and gaseous fuels is rapidly growing. Supportive government policies, carbon pricing, and green fuel mandates are accelerating investment and innovation in the space. Technological advancements in Power-to-Liquid processes, carbon capture, and green hydrogen production are improving efficiency and cost viability. With growing energy security concerns and corporate sustainability goals, e-fuels are emerging as a key pillar in the global transition toward clean, circular energy systems.
- Product Development/Innovation: The e-fuels market is advancing through product innovations focused on enhancing production efficiency, scalability, and environmental performance. Companies are developing advanced Power-to-Liquid (PtL) and Power-to-Gas (PtG) technologies that enable efficient conversion of renewable electricity, water, and captured CO2 into high-quality synthetic fuels. Innovations in electrolyzer technology, carbon capture systems, and reactor design are significantly improving energy conversion rates and reducing production costs. Modular and scalable e-fuel production units enable decentralized fuel generation, which is ideal for remote or off-grid applications. Integration with digital platforms supports process optimization, real-time emissions tracking, and energy flow monitoring. Furthermore, breakthroughs in catalyst development and synthetic fuel refining are improving fuel purity and engine compatibility. Research into direct air capture, co-electrolysis, and new feedstock pathways is expanding the versatility of e-fuel production. These innovations are not only accelerating commercialization but also enhancing the viability of e-fuels as a cornerstone of sustainable, net-zero energy systems.
- Market Development: In October 2024, Saudi Arabian Oil Co., a global integrated energy and chemicals company, and ENOWA, NEOM's energy and water company, signed a joint development agreement to construct and establish a first-of-its-kind synthetic electro fuel (e-fuel) demonstration plant. It aims to demonstrate technical feasibility and commercial viability by producing 35 barrels per day of low-carbon, synthetic gasoline from renewable-based hydrogen and captured carbon dioxide (CO2).
- Market Diversification: In May 2025, Uniper and thyssenkrupp Uhde partnered to develop a large-scale ammonia cracker plant in Gelsenkirchen, Germany, capable of converting 28 tons/day of ammonia into hydrogen. This demonstration project supports global hydrogen trade and the hydrogen import terminal in Wilhelmshaven, enabling ammonia to be an e-fuel carrier.
- Competitive Assessment: Assessment of rankings of some of the key players, including of Saudi Arabian Oil Co. (Saudi Arabia), AUDI AG (Germany), Repsol (Spain), Sunfire SE (Germany), Electrochaea GmbH (Germany), Uniper SE (Germany), Orsted A/S (Denmark), Yara (Norway), Perstorp (Germany), HIF Global (US), INFINIUM (US), INERATEC GmbH (Germany), Liquid Wind (Sweden), Norsk e-fuel (Norway), Nordic Electrofuel (Norway), European Energy (Denmark) among others.
TABLE OF CONTENTS
1 INTRODUCTION
- 1.1 STUDY OBJECTIVES
- 1.2 MARKET DEFINITION
- 1.3 STUDY SCOPE
- 1.3.1 MARKETS COVERED AND REGIONAL SCOPE
- 1.3.2 INCLUSIONS AND EXCLUSIONS
- 1.3.3 YEARS CONSIDERED
- 1.4 CURRENCY CONSIDERED
- 1.5 UNIT CONSIDERED
- 1.6 LIMITATIONS
- 1.7 STAKEHOLDERS
- 1.8 SUMMARY OF CHANGES
2 RESEARCH METHODOLOGY
- 2.1 RESEARCH DATA
- 2.1.1 SECONDARY DATA
- 2.1.1.1 List of key secondary sources
- 2.1.1.2 Key data from secondary sources
- 2.1.2 PRIMARY DATA
- 2.1.2.1 List of primary interview participants
- 2.1.2.2 Key industry insights
- 2.1.2.3 Breakdown of primaries
- 2.1.2.4 Key data from primary sources
- 2.1.1 SECONDARY DATA
- 2.2 MARKET SIZE ESTIMATION
- 2.2.1 BOTTOM-UP APPROACH
- 2.2.1.1 Demand-side assumptions
- 2.2.1.2 Demand-side calculations
- 2.2.2 TOP-DOWN APPROACH
- 2.2.2.1 Supply-side assumptions
- 2.2.2.2 Supply-side calculations
- 2.2.1 BOTTOM-UP APPROACH
- 2.3 MARKET BREAKDOWN AND DATA TRIANGULATION
- 2.4 FORECAST
- 2.5 RESEARCH LIMITATIONS
- 2.6 RISK ANALYSIS
3 EXECUTIVE SUMMARY
4 PREMIUM INSIGHTS
- 4.1 ATTRACTIVE OPPORTUNITIES FOR PLAYERS IN E-FUELS MARKET
- 4.2 E-FUELS MARKET, BY REGION
- 4.3 E-FUELS MARKET, BY STATE
- 4.4 E-FUELS MARKET, BY TYPE
- 4.5 E-FUELS MARKET, BY APPLICATION
- 4.6 E-FUELS MARKET, BY END USE
- 4.7 E-FUELS MARKET IN EUROPE, BY STATE AND COUNTRY
5 MARKET OVERVIEW
- 5.1 INTRODUCTION
- 5.2 MARKET DYNAMICS
- 5.2.1 DRIVERS
- 5.2.1.1 Rising implementation of supportive frameworks for low- carbon fuel adoption
- 5.2.1.2 Growing emphasis on sustainable transport to conform to strict emission standards
- 5.2.2 RESTRAINTS
- 5.2.2.1 High initial capital investment
- 5.2.2.2 Mounting adoption of electric vehicles (EVs)
- 5.2.3 OPPORTUNITIES
- 5.2.3.1 Depletion of fossil fuels and push for decarbonization
- 5.2.3.2 Rising need to decarbonize aviation and shipping industries
- 5.2.4 CHALLENGES
- 5.2.4.1 Requirement for significant energy for e-fuel production
- 5.2.4.2 Limited production capacity
- 5.2.1 DRIVERS
- 5.3 TRENDS/DISRUPTIONS IMPACTING CUSTOMER BUSINESS
- 5.4 SUPPLY CHAIN ANALYSIS
- 5.5 ECOSYSTEM ANALYSIS
- 5.6 TECHNOLOGY ANALYSIS
- 5.6.1 KEY TECHNOLOGIES
- 5.6.1.1 Fischer-Tropsch (FT) synthesis
- 5.6.1.2 Methanation
- 5.6.1.3 Machine learning
- 5.6.2 COMPLEMENTARY TECHNOLOGIES
- 5.6.2.1 Reverse water-gas shift reaction
- 5.6.2.2 Electrolyzers
- 5.6.3 ADJACENT TECHNOLOGIES
- 5.6.3.1 Artificial intelligence
- 5.6.3.2 Advanced catalysts
- 5.6.1 KEY TECHNOLOGIES
- 5.7 CASE STUDY ANALYSIS
- 5.7.1 RESEARCHERS DEVELOP SIMULATION FRAMEWORK FOR MULTI-E-FUEL INFRASTRUCTURE TO DECARBONIZE HEAVY-DUTY TRANSPORT
- 5.7.2 HIF GLOBAL LAUNCHES HARU ONI PROJECT TO INTEGRATE RENEWABLE POWER, GREEN HYDROGEN, AND DAC-BASED CO2 CAPTURE FOR E-FUEL SYNTHESIS
- 5.7.3 BANKABLE FEASIBILITY STUDY SUPPORTS BIOAGRA'S TRANSITION INTO E-FUEL PRODUCTION
- 5.8 PATENT ANALYSIS
- 5.9 KEY CONFERENCES AND EVENTS, 2025-2026
- 5.10 PRICING ANALYSIS
- 5.10.1 AVERAGE SELLING PRICE TREND OF E-FUELS, BY TYPE, 2022-2024
- 5.10.2 AVERAGE SELLING PRICE TREND OF E-FUELS, BY REGION, 2022-2024
- 5.11 TRADE ANALYSIS
- 5.11.1 IMPORT SCENARIO (HS CODE 2814)
- 5.11.2 EXPORT SCENARIO (HS CODE 2814)
- 5.12 REGULATORY LANDSCAPE
- 5.12.1 REGULATORY BODIES, GOVERNMENT AGENCIES, AND OTHER ORGANIZATIONS
- 5.12.2 REGULATORY FRAMEWORK
- 5.13 PORTER'S FIVE FORCES ANALYSIS
- 5.13.1 THREAT OF NEW ENTRANTS
- 5.13.2 THREAT OF SUBSTITUTES
- 5.13.3 BARGAINING POWER OF SUPPLIERS
- 5.13.4 BARGAINING POWER OF BUYERS
- 5.13.5 INTENSITY OF COMPETITIVE RIVALRY
- 5.14 KEY STAKEHOLDERS AND BUYING CRITERIA
- 5.14.1 KEY STAKEHOLDERS IN BUYING PROCESS
- 5.14.2 BUYING CRITERIA
- 5.15 INVESTMENT AND FUNDING SCENARIO
- 5.16 IMPACT OF AI/GEN AI ON E-FUELS MARKET
- 5.16.1 ADOPTION OF AI/GEN AI IN E-FUEL APPLICATIONS
- 5.16.2 IMPACT OF AI/GEN AI ON E-FUEL SUPPLY CHAIN, BY REGION
- 5.17 GLOBAL MACROECONOMIC OUTLOOK
- 5.17.1 INTRODUCTION
- 5.17.2 FOCUS ON CARBON-NEUTRAL MOBILITY AND INDUSTRY
- 5.17.3 TECHNOLOGICAL ADVANCEMENTS
- 5.17.4 FINANCING AND GOVERNMENT POLICY SUPPORT
- 5.17.5 HIGH CAPEX AMID INFLATION
- 5.18 IMPACT OF 2025 US TARIFF ON E-FUELS MARKET
- 5.18.1 INTRODUCTION
- 5.18.2 KEY TARIFF RATES
- 5.18.3 PRICE IMPACT ANALYSIS
- 5.18.4 IMPACT ON COUNTRIES/REGIONS
- 5.18.4.1 US
- 5.18.4.2 Europe
- 5.18.4.3 Asia Pacific
- 5.18.5 IMPACT ON IMPORTS/EXPORTS
- 5.18.6 TARIFF SHIFTS AND QATAR ENERGY'S GROWTH IN GLOBAL E-FUELS SPACE
- 5.18.7 IMPACT ON END USES
6 RENEWABLE SOURCES USED IN E-FUEL PRODUCTION
- 6.1 INTRODUCTION
- 6.2 SOLAR ENERGY
- 6.3 WIND ENERGY
- 6.4 HYDROPOWER
7 E-FUELS MARKET, BY TYPE
- 7.1 INTRODUCTION
- 7.2 E-METHANE
- 7.2.1 HIGH ADAPTABILITY AND COST-EFFECTIVENESS FOR LARGE-SCALE ADOPTION TO FUEL SEGMENTAL GROWTH
- 7.3 E-METHANOL
- 7.3.1 SURGING DEMAND FOR GREEN MARINE FUELS AND CHEMICAL FEEDSTOCKS TO ACCELERATE SEGMENTAL GROWTH
- 7.4 E-AMMONIA
- 7.4.1 GROWING EMPHASIS ON SUSTAINABILITY IN FERTILIZER SECTOR TO BOLSTER SEGMENTAL GROWTH
- 7.5 E-GASOLINE
- 7.5.1 RISING IMPLEMENTATION OF CARBON PRICING AND RENEWABLE FUEL MANDATES TO EXPEDITE SEGMENTAL GROWTH
- 7.6 E-KEROSENE
- 7.6.1 ABILITY TO REDUCE LIFECYCLE GREENHOUSE GAS EMISSIONS TO CONTRIBUTE TO SEGMENTAL GROWTH
- 7.7 E-DIESEL
- 7.7.1 INCREASING REGULATORY PRESSURE TO CURB EMISSIONS FROM HEAVY-DUTY VEHICLES TO AUGMENT SEGMENTAL GROWTH
8 E-FUELS MARKET, BY STATE
- 8.1 INTRODUCTION
- 8.2 GASEOUS (POWER-TO-GAS)
- 8.2.1 ABILITY TO SUPPORT DECARBONIZATION EFFORTS ACROSS POWER GENERATION AND INDUSTRIAL SECTORS TO DRIVE MARKET
- 8.3 LIQUID (POWER-TO-LIQUID)
- 8.3.1 STRONG FOCUS ON SUSTAINABILITY, ENERGY SECURITY, AND EMISSION REDUCTION TO AUGMENT SEGMENTAL GROWTH
9 E-FUELS MARKET, BY APPLICATION
- 9.1 INTRODUCTION
- 9.2 FUEL
- 9.2.1 IMPLEMENTATION OF STRINGENT EMISSION REGULATIONS TO CONTRIBUTE TO SEGMENTAL GROWTH
- 9.3 NON-FUEL
- 9.3.1 INDUSTRIAL DECARBONIZATION AND GREEN CHEMICAL DEMAND TO BOOST SEGMENTAL GROWTH
10 E-FUELS MARKET, BY END USE
- 10.1 INTRODUCTION
- 10.2 TRANSPORTATION
- 10.2.1 GROWING EMPHASIS ON ACHIEVING NET-ZERO EMISSIONS TO FOSTER SEGMENTAL GROWTH
- 10.2.1.1 Automotive
- 10.2.1.2 Marine
- 10.2.1.3 Aviation
- 10.2.1 GROWING EMPHASIS ON ACHIEVING NET-ZERO EMISSIONS TO FOSTER SEGMENTAL GROWTH
- 10.3 CHEMICALS
- 10.3.1 INCREASING DEVELOPMENT OF LOW-CARBON OR CLIMATE-NEUTRAL INGREDIENTS TO ACCELERATE SEGMENTAL GROWTH
- 10.4 POWER GENERATION
- 10.4.1 RISING INTEGRATION OF E-METHANE INTO ENERGY MIXES TO BALANCE INTERMITTENT RENEWABLES TO DRIVE MARKET
- 10.5 GRID INJECTION
- 10.5.1 GROWING FOCUS ON SYSTEMIC DECARBONIZATION OF THERMAL ENERGY NETWORKS TO BOLSTER SEGMENTAL GROWTH
- 10.6 OTHER END USES
11 E-FUELS MARKET, BY REGION
- 11.1 INTRODUCTION
- 11.2 EUROPE
- 11.2.1 GERMANY
- 11.2.1.1 High preference for renewable synthetic fuels to contribute to market growth
- 11.2.2 NORWAY
- 11.2.2.1 Growing emphasis on producing sustainable aviation fuels to boost market growth
- 11.2.3 UK
- 11.2.3.1 Rising implementation of clean ammonia and synthetic fuel projects to drive market
- 11.2.4 DENMARK
- 11.2.4.1 Increasing focus on reducing carbon dioxide emissions to foster market growth
- 11.2.5 SWEDEN
- 11.2.5.1 Growing consumption of renewable electricity to accelerate market growth
- 11.2.6 REST OF EUROPE
- 11.2.1 GERMANY
- 11.3 ASIA PACIFIC
- 11.3.1 CHINA
- 11.3.1.1 Mounting demand for clean fuels to achieve carbon neutrality to augment market growth
- 11.3.2 AUSTRALIA
- 11.3.2.1 Abundant renewable energy resources to contribute to market growth
- 11.3.3 INDIA
- 11.3.3.1 Rapid transition toward clean energy to meet decarbonization goals to create lucrative market growth opportunities
- 11.3.4 REST OF ASIA PACIFIC
- 11.3.1 CHINA
- 11.4 NORTH AMERICA
- 11.4.1 US
- 11.4.1.1 Rising development of local supply chains for clean energy to expedite market growth
- 11.4.2 CANADA
- 11.4.2.1 Growing focus on sustainable aviation and low-carbon synthetic fuels to boost market growth
- 11.4.1 US
- 11.5 ROW
- 11.5.1 MIDDLE EAST & AFRICA
- 11.5.1.1 Strong focus on diversifying oil-dependent economies to foster market growth
- 11.5.2 SOUTH AMERICA
- 11.5.2.1 Burgeoning demand for low-carbon fuels to accelerate market growth
- 11.5.1 MIDDLE EAST & AFRICA
12 COMPETITIVE LANDSCAPE
- 12.1 INTRODUCTION
- 12.2 KEY PLAYER STRATEGIES/RIGHT TO WIN, 2020-2025
- 12.3 REVENUE ANALYSIS, 2020-2024
- 12.4 MARKET SHARE ANALYSIS, 2024
- 12.5 COMPANY VALUATION AND FINANCIAL METRICS
- 12.6 PRODUCT COMPARISON
- 12.7 COMPANY EVALUATION MATRIX: KEY PLAYERS, 2024
- 12.7.1 STARS
- 12.7.2 EMERGING LEADERS
- 12.7.3 PERVASIVE PLAYERS
- 12.7.4 PARTICIPANTS
- 12.7.5 COMPANY FOOTPRINT: KEY PLAYERS, 2024
- 12.7.5.1 Company footprint
- 12.7.5.2 Region footprint
- 12.7.5.3 Type footprint
- 12.7.5.4 State footprint
- 12.7.5.5 Application footprint
- 12.7.5.6 End use footprint
- 12.8 COMPANY EVALUATION MATRIX: STARTUPS/SMES, 2024
- 12.8.1 PROGRESSIVE COMPANIES
- 12.8.2 RESPONSIVE COMPANIES
- 12.8.3 DYNAMIC COMPANIES
- 12.8.4 STARTING BLOCKS
- 12.8.5 COMPETITIVE BENCHMARKING: STARTUPS/SMES, 2024
- 12.8.5.1 Detailed list of key startups/SMEs
- 12.8.5.2 Competitive benchmarking of key startups/SMEs
- 12.9 COMPETITIVE SCENARIO
- 12.9.1 DEALS
- 12.9.2 EXPANSIONS
- 12.9.3 OTHER DEVELOPMENTS
13 COMPANY PROFILES
- 13.1 KEY PLAYERS
- 13.1.1 SAUDI ARABIAN OIL CO.
- 13.1.1.1 Business overview
- 13.1.1.2 Products/Solutions/Services offered
- 13.1.1.3 Recent developments
- 13.1.1.3.1 Deals
- 13.1.1.4 MnM view
- 13.1.1.4.1 Key strengths/Right to win
- 13.1.1.4.2 Strategic choices
- 13.1.1.4.3 Weaknesses/Competitive threats
- 13.1.2 AUDI AG
- 13.1.2.1 Business overview
- 13.1.2.2 Products/Solutions/Services offered
- 13.1.2.3 MnM view
- 13.1.2.3.1 Key strengths/Right to win
- 13.1.2.3.2 Strategic choices
- 13.1.2.3.3 Weaknesses/Competitive threats
- 13.1.3 REPSOL
- 13.1.3.1 Business overview
- 13.1.3.2 Products/Solutions/Services offered
- 13.1.3.3 Recent developments
- 13.1.3.3.1 Deals
- 13.1.3.3.2 Expansions
- 13.1.3.3.3 Other developments
- 13.1.3.4 MnM view
- 13.1.3.4.1 Key strengths/Right to win
- 13.1.3.4.2 Strategic choices
- 13.1.3.4.3 Weaknesses/Competitive threats
- 13.1.4 SUNFIRE SE
- 13.1.4.1 Business overview
- 13.1.4.2 Products/Solutions/Services offered
- 13.1.4.3 Recent developments
- 13.1.4.3.1 Deals
- 13.1.4.4 MnM view
- 13.1.4.4.1 Key strengths/Right to win
- 13.1.4.4.2 Strategic choices
- 13.1.4.4.3 Weaknesses/Competitive threats
- 13.1.5 ELECTROCHAEA GMBH
- 13.1.5.1 Business overview
- 13.1.5.2 Products/Solutions/Services offered
- 13.1.5.3 Recent developments
- 13.1.5.3.1 Deals
- 13.1.5.3.2 Expansions
- 13.1.5.4 MnM view
- 13.1.5.4.1 Key strengths/Right to win
- 13.1.5.4.2 Strategic choices
- 13.1.5.4.3 Weaknesses/Competitive threats
- 13.1.6 UNIPER SE
- 13.1.6.1 Business overview
- 13.1.6.2 Products/Solutions/Services offered
- 13.1.6.3 Recent developments
- 13.1.6.3.1 Deals
- 13.1.6.3.2 Other developments
- 13.1.7 ORSTED A/S
- 13.1.7.1 Business overview
- 13.1.7.2 Products/Solutions/Services offered
- 13.1.7.3 Recent developments
- 13.1.7.3.1 Deals
- 13.1.8 YARA
- 13.1.8.1 Business overview
- 13.1.8.2 Products/Solutions/Services offered
- 13.1.8.3 Recent developments
- 13.1.8.3.1 Deals
- 13.1.8.3.2 Expansions
- 13.1.9 PERSTORP
- 13.1.9.1 Business overview
- 13.1.9.2 Products/Solutions/Services offered
- 13.1.9.3 Recent developments
- 13.1.9.3.1 Deals
- 13.1.9.3.2 Expansions
- 13.1.9.3.3 Other developments
- 13.1.10 HIF GLOBAL
- 13.1.10.1 Business overview
- 13.1.10.2 Products/Solutions/Services offered
- 13.1.10.3 Recent developments
- 13.1.10.3.1 Deals
- 13.1.10.3.2 Other developments
- 13.1.11 INFINIUM
- 13.1.11.1 Business overview
- 13.1.11.2 Products/Solutions/Services offered
- 13.1.11.3 Recent developments
- 13.1.11.3.1 Deals
- 13.1.11.3.2 Expansions
- 13.1.11.3.3 Other developments
- 13.1.12 INERATEC GMBH
- 13.1.12.1 Business overview
- 13.1.12.2 Products/Solutions/Services offered
- 13.1.12.3 Recent developments
- 13.1.12.3.1 Deals
- 13.1.12.3.2 Expansions
- 13.1.12.3.3 Other developments
- 13.1.13 LIQUID WIND
- 13.1.13.1 Business overview
- 13.1.13.2 Products/Solutions/Services offered
- 13.1.13.3 Recent developments
- 13.1.13.3.1 Deals
- 13.1.13.3.2 Expansions
- 13.1.14 NORSK E-FUEL
- 13.1.14.1 Business overview
- 13.1.14.2 Products/Solutions/Services offered
- 13.1.14.3 Recent developments
- 13.1.14.3.1 Deals
- 13.1.15 NORDIC ELECTROFUEL
- 13.1.15.1 Business overview
- 13.1.15.2 Products/Solutions/Services offered
- 13.1.15.3 Recent developments
- 13.1.15.3.1 Deals
- 13.1.15.3.2 Expansions
- 13.1.15.3.3 Other developments
- 13.1.16 EUROPEAN ENERGY
- 13.1.16.1 Business overview
- 13.1.16.2 Products/Solutions/Services offered
- 13.1.16.3 Recent developments
- 13.1.16.3.1 Deals
- 13.1.16.3.2 Expansions
- 13.1.1 SAUDI ARABIAN OIL CO.
- 13.2 OTHER PLAYERS
- 13.2.1 CARBON RECYCLING INTERNATIONAL
- 13.2.2 SYNHELION AG
- 13.2.3 ARCADIA EFUELS
- 13.2.4 SKYNRG
- 13.2.5 NATRAN
- 13.2.6 SKOVGAARD ENERGY
- 13.2.7 NESTE
- 13.2.8 TURN2X
- 13.2.9 P2X-EUROPE GMBH & CO. KG
14 APPENDIX
- 14.1 INSIGHTS FROM INDUSTRY EXPERTS
- 14.2 DISCUSSION GUIDE
- 14.3 KNOWLEDGESTORE: MARKETSANDMARKETS' SUBSCRIPTION PORTAL
- 14.4 CUSTOMIZATION OPTIONS
- 14.5 RELATED REPORTS
- 14.6 AUTHOR DETAILS
List of Tables
- TABLE 1 INCLUSIONS AND EXCLUSIONS IN E-FUELS MARKET REPORT
- TABLE 2 MAJOR SECONDARY SOURCES
- TABLE 3 PRIMARY INTERVIEW PARTICIPANT DETAILS, BY COMPANY
- TABLE 4 DATA CAPTURED FROM PRIMARY SOURCES
- TABLE 5 E-FUELS MARKET: RISK ANALYSIS
- TABLE 6 E-FUELS MARKET SNAPSHOT
- TABLE 7 ROLE OF COMPANIES IN E-FUELS ECOSYSTEM
- TABLE 8 LIST OF KEY PATENTS, 2019-2024
- TABLE 9 LIST OF KEY CONFERENCES AND EVENTS, 2025-2026
- TABLE 10 AVERAGE SELLING PRICE TREND OF E-FUELS, BY TYPE, 2022-2024 (USD/LITER)
- TABLE 11 AVERAGE SELLING PRICE TREND OF E-FUELS, BY REGION, 2022-2024 (USD/LITER)
- TABLE 12 IMPORT DATA FOR HS CODE 2814-COMPLIANT PRODUCTS, BY COUNTRY, 2020-2024 (USD THOUSAND)
- TABLE 13 EXPORT DATA FOR HS CODE 2814-COMPLIANT PRODUCTS, BY COUNTRY, 2020-2024 (USD THOUSAND)
- TABLE 14 EUROPE: REGULATORY BODIES, GOVERNMENT AGENCIES, AND OTHER ORGANIZATIONS
- TABLE 15 ASIA PACIFIC: REGULATORY BODIES, GOVERNMENT AGENCIES, AND OTHER ORGANIZATIONS
- TABLE 16 NORTH AMERICA: REGULATORY BODIES, GOVERNMENT AGENCIES, AND OTHER ORGANIZATIONS
- TABLE 17 ROW: REGULATORY BODIES, GOVERNMENT AGENCIES, AND OTHER ORGANIZATIONS
- TABLE 18 REGULATORY FRAMEWORK IN EUROPE
- TABLE 19 REGULATORY FRAMEWORK IN NORTH AMERICA
- TABLE 20 REGULATORY FRAMEWORK IN ASIA PACIFIC
- TABLE 21 IMPACT OF PORTER'S FIVE FORCES
- TABLE 22 INFLUENCE OF KEY STAKEHOLDERS ON BUYING PROCESS FOR TOP THREE END USES (%)
- TABLE 23 KEY BUYING CRITERIA FOR TOP THREE END USES
- TABLE 24 US-ADJUSTED RECIPROCAL TARIFF RATES, 2024 (USD BILLION)
- TABLE 25 EXPECTED CHANGE IN PRICES AND LIKELY IMPACT ON STATION TYPES DUE TO TARIFF
- TABLE 26 E-FUELS MARKET, BY TYPE, 2022-2024 (USD MILLION)
- TABLE 27 E-FUELS MARKET, BY TYPE, 2025-2030 (USD MILLION)
- TABLE 28 E-FUELS MARKET, BY TYPE, 2022-2024 (MILLION LITERS)
- TABLE 29 E-FUELS MARKET, BY TYPE, 2025-2030 (MILLION LITERS)
- TABLE 30 E-METHANE: E-FUELS MARKET, BY REGION, 2022-2024 (USD MILLION)
- TABLE 31 E-METHANE: E-FUELS MARKET, BY REGION, 2025-2030 (USD MILLION)
- TABLE 32 E-METHANE: E-FUELS MARKET, BY REGION, 2022-2024 (MILLION LITERS)
- TABLE 33 E-METHANE: E-FUELS MARKET, BY REGION, 2025-2030 (MILLION LITERS)
- TABLE 34 E-METHANOL: E-FUELS MARKET, BY REGION, 2022-2024 (USD MILLION)
- TABLE 35 E-METHANOL: E-FUELS MARKET, BY REGION, 2025-2030 (USD MILLION)
- TABLE 36 E-METHANOL: E-FUELS MARKET, BY REGION, 2022-2024 (MILLION LITERS)
- TABLE 37 E-METHANOL: E-FUELS MARKET, BY REGION, 2025-2030 (MILLION LITERS)
- TABLE 38 E-AMMONIA: E-FUELS MARKET, BY REGION, 2022-2024 (USD MILLION)
- TABLE 39 E-AMMONIA: E-FUELS MARKET, BY REGION, 2025-2030 (USD MILLION)
- TABLE 40 E-AMMONIA: E-FUELS MARKET, BY REGION, 2022-2024 (MILLION LITERS)
- TABLE 41 E-AMMONIA: E-FUELS MARKET, BY REGION, 2025-2030 (MILLION LITERS)
- TABLE 42 E-GASOLINE: E-FUELS MARKET, BY REGION, 2022-2024 (USD MILLION)
- TABLE 43 E-GASOLINE: E-FUELS MARKET, BY REGION, 2025-2030 (USD MILLION)
- TABLE 44 E-GASOLINE: E-FUELS MARKET, BY REGION, 2022-2024 (MILLION LITERS)
- TABLE 45 E-GASOLINE: E-FUELS MARKET, BY REGION, 2025-2030 (MILLION LITERS)
- TABLE 46 E-KEROSENE: E-FUELS MARKET, BY REGION, 2022-2024 (USD MILLION)
- TABLE 47 E-KEROSENE: E-FUELS MARKET, BY REGION, 2025-2030 (USD MILLION)
- TABLE 48 E-KEROSENE: E-FUELS MARKET, BY REGION, 2022-2024 (MILLION LITERS)
- TABLE 49 E-KEROSENE: E-FUELS MARKET, BY REGION, 2025-2030 (MILLION LITERS)
- TABLE 50 E-DIESEL: E-FUELS MARKET, BY REGION, 2022-2024 (USD MILLION)
- TABLE 51 E-DIESEL: E-FUELS MARKET, BY REGION, 2025-2030 (USD MILLION)
- TABLE 52 E-DIESEL: E-FUELS MARKET, BY REGION, 2022-2024 (MILLION LITERS)
- TABLE 53 E-DIESEL: E-FUELS MARKET, BY REGION, 2025-2030 (MILLION LITERS)
- TABLE 54 E-FUELS MARKET, BY STATE, 2022-2024 (USD MILLION)
- TABLE 55 E-FUELS MARKET, BY STATE, 2025-2030 (USD MILLION)
- TABLE 56 GASEOUS (POWER-TO-GAS): E-FUELS MARKET, BY REGION, 2022-2024 (USD MILLION)
- TABLE 57 GASEOUS (POWER-TO-GAS): E-FUELS MARKET, BY REGION, 2025-2030 (USD MILLION)
- TABLE 58 LIQUID (POWER-TO-LIQUID): E-FUELS MARKET, BY REGION, 2022-2024 (USD MILLION)
- TABLE 59 LIQUID (POWER-TO-LIQUID): E-FUELS MARKET, BY REGION, 2025-2030 (USD MILLION)
- TABLE 60 E-FUELS MARKET, BY APPLICATION, 2022-2024 (USD MILLION)
- TABLE 61 E-FUELS MARKET, BY APPLICATION, 2025-2030 (USD MILLION)
- TABLE 62 FUEL: E-FUELS MARKET, BY REGION, 2022-2024 (USD MILLION)
- TABLE 63 FUEL: E-FUELS MARKET, BY REGION, 2025-2030 (USD MILLION)
- TABLE 64 NON-FUEL: E-FUELS MARKET, BY REGION, 2022-2024 (USD MILLION)
- TABLE 65 NON-FUEL: E-FUELS MARKET, BY REGION, 2025-2030 (USD MILLION)
- TABLE 66 E-FUELS MARKET, BY END USE, 2022-2024 (USD MILLION)
- TABLE 67 E-FUELS MARKET, BY END USE, 2025-2030 (USD MILLION)
- TABLE 68 TRANSPORTATION: E-FUELS MARKET, BY REGION, 2022-2024 (USD MILLION)
- TABLE 69 TRANSPORTATION: E-FUELS MARKET, BY REGION, 2025-2030 (USD MILLION)
- TABLE 70 TRANSPORTATION: E-FUELS MARKET IN NORTH AMERICA, BY COUNTRY, 2022-2024 (USD MILLION)
- TABLE 71 TRANSPORTATION: E-FUELS MARKET IN NORTH AMERICA, BY COUNTRY, 2025-2030 (USD MILLION)
- TABLE 72 TRANSPORTATION: E-FUELS MARKET IN ASIA PACIFIC, BY COUNTRY, 2022-2024 (USD MILLION)
- TABLE 73 TRANSPORTATION: E-FUELS MARKET IN ASIA PACIFIC, BY COUNTRY, 2025-2030 (USD MILLION)
- TABLE 74 TRANSPORTATION: E-FUELS MARKET IN EUROPE, BY COUNTRY, 2022-2024 (USD MILLION)
- TABLE 75 TRANSPORTATION: E-FUELS MARKET IN EUROPE, BY COUNTRY, 2025-2030 (USD MILLION)
- TABLE 76 TRANSPORTATION: E-FUELS MARKET IN ROW, BY REGION, 2022-2024 (USD MILLION)
- TABLE 77 TRANSPORTATION: E-FUELS MARKET IN ROW, BY REGION, 2025-2030 (USD MILLION)
- TABLE 78 CHEMICALS: E-FUELS MARKET, BY REGION, 2022-2024 (USD MILLION)
- TABLE 79 CHEMICALS: E-FUELS MARKET, BY REGION, 2025-2030 (USD MILLION)
- TABLE 80 CHEMICALS: E-FUELS MARKET IN NORTH AMERICA, BY COUNTRY, 2022-2024 (USD MILLION)
- TABLE 81 CHEMICALS: E-FUELS MARKET IN NORTH AMERICA, BY COUNTRY, 2025-2030 (USD MILLION)
- TABLE 82 CHEMICALS: E-FUELS MARKET IN ASIA PACIFIC, BY COUNTRY, 2022-2024 (USD MILLION)
- TABLE 83 CHEMICALS: E-FUELS MARKET IN ASIA PACIFIC, BY COUNTRY, 2025-2030 (USD MILLION)
- TABLE 84 CHEMICALS: E-FUELS MARKET IN EUROPE, BY COUNTRY, 2022-2024 (USD MILLION)
- TABLE 85 CHEMICALS: E-FUELS MARKET IN EUROPE, BY COUNTRY, 2025-2030 (USD MILLION)
- TABLE 86 CHEMICALS: E-FUELS MARKET IN ROW, BY REGION, 2022-2024 (USD MILLION)
- TABLE 87 CHEMICALS: E-FUELS MARKET IN ROW, BY REGION, 2025-2030 (USD MILLION)
- TABLE 88 POWER GENERATION: E-FUELS MARKET, BY REGION, 2022-2024 (USD MILLION)
- TABLE 89 POWER GENERATION: E-FUELS MARKET, BY REGION, 2025-2030 (USD MILLION)
- TABLE 90 POWER GENERATION: E-FUELS MARKET IN NORTH AMERICA, BY COUNTRY, 2022-2024 (USD MILLION)
- TABLE 91 POWER GENERATION: E-FUELS MARKET IN NORTH AMERICA, BY COUNTRY, 2025-2030 (USD MILLION)
- TABLE 92 POWER GENERATION: E-FUELS MARKET IN ASIA PACIFIC, BY COUNTRY, 2022-2024 (USD MILLION)
- TABLE 93 POWER GENERATION: E-FUELS MARKET IN ASIA PACIFIC, BY COUNTRY, 2025-2030 (USD MILLION)
- TABLE 94 POWER GENERATION: E-FUELS MARKET IN EUROPE, BY COUNTRY, 2022-2024 (USD MILLION)
- TABLE 95 POWER GENERATION: E-FUELS MARKET IN EUROPE, BY COUNTRY, 2025-2030 (USD MILLION)
- TABLE 96 POWER GENERATION: E-FUELS MARKET IN ROW, BY REGION, 2022-2024 (USD MILLION)
- TABLE 97 POWER GENERATION: E-FUELS MARKET IN ROW, BY REGION, 2025-2030 (USD MILLION)
- TABLE 98 GRID INJECTION: E-FUELS MARKET, BY REGION, 2022-2024 (USD MILLION)
- TABLE 99 GRID INJECTION: E-FUELS MARKET, BY REGION, 2025-2030 (USD MILLION)
- TABLE 100 GRID INJECTION: E-FUELS MARKET IN NORTH AMERICA, BY COUNTRY, 2022-2024 (USD MILLION)
- TABLE 101 GRID INJECTION: E-FUELS MARKET IN NORTH AMERICA, BY COUNTRY, 2025-2030 (USD MILLION)
- TABLE 102 GRID INJECTION: E-FUELS MARKET IN ASIA PACIFIC, BY COUNTRY, 2022-2024 (USD MILLION)
- TABLE 103 GRID INJECTION: E-FUELS MARKET IN ASIA PACIFIC, BY COUNTRY, 2025-2030 (USD MILLION)
- TABLE 104 GRID INJECTION: E-FUELS MARKET IN EUROPE, BY COUNTRY, 2022-2024 (USD MILLION)
- TABLE 105 GRID INJECTION: E-FUELS MARKET IN EUROPE, BY COUNTRY, 2025-2030 (USD MILLION)
- TABLE 106 GRID INJECTION: E-FUELS MARKET IN ROW, BY REGION, 2022-2024 (USD MILLION)
- TABLE 107 GRID INJECTION: E-FUELS MARKET IN ROW, BY REGION, 2025-2030 (USD MILLION)
- TABLE 108 OTHER END USES: E-FUELS MARKET, BY REGION, 2022-2024 (USD MILLION)
- TABLE 109 OTHER END USES: E-FUELS MARKET, BY REGION, 2025-2030 (USD MILLION)
- TABLE 110 OTHER END USES: E-FUELS MARKET IN NORTH AMERICA, BY COUNTRY, 2022-2024 (USD MILLION)
- TABLE 111 OTHER END USES: E-FUELS MARKET IN NORTH AMERICA, BY COUNTRY, 2025-2030 (USD MILLION)
- TABLE 112 OTHER END USES: E-FUELS MARKET IN ASIA PACIFIC, BY COUNTRY, 2022-2024 (USD MILLION)
- TABLE 113 OTHER END USES: E-FUELS MARKET IN ASIA PACIFIC, BY COUNTRY, 2025-2030 (USD MILLION)
- TABLE 114 OTHER END USES: E-FUELS MARKET IN EUROPE, BY COUNTRY, 2022-2024 (USD MILLION)
- TABLE 115 OTHER END USES: E-FUELS MARKET IN EUROPE, BY COUNTRY, 2025-2030 (USD MILLION)
- TABLE 116 OTHER END USES: E-FUELS MARKET IN ROW, BY REGION, 2022-2024 (USD MILLION)
- TABLE 117 OTHER END USES: E-FUELS MARKET IN ROW, BY REGION, 2025-2030 (USD MILLION)
- TABLE 118 E-FUELS MARKET, BY REGION, 2022-2024 (USD MILLION)
- TABLE 119 E-FUELS MARKET, BY REGION, 2025-2030 (USD MILLION)
- TABLE 120 E-FUELS MARKET, BY REGION, 2022-2024 (MILLION LITERS)
- TABLE 121 E-FUELS MARKET, BY REGION, 2025-2030 (MILLION LITERS)
- TABLE 122 EUROPE: E-FUELS MARKET, BY STATE, 2022-2024 (USD MILLION)
- TABLE 123 EUROPE: E-FUELS MARKET, BY STATE, 2025-2030 (USD MILLION)
- TABLE 124 EUROPE: E-FUELS MARKET, BY TYPE, 2022-2024 (USD MILLION)
- TABLE 125 EUROPE: E-FUELS MARKET, BY TYPE, 2025-2030 (USD MILLION)
- TABLE 126 EUROPE: E-FUELS MARKET, BY TYPE, 2022-2024 (MILLION LITERS)
- TABLE 127 EUROPE: E-FUELS MARKET, BY TYPE, 2025-2030 (MILLION LITERS)
- TABLE 128 EUROPE: E-FUELS MARKET, BY APPLICATION, 2022-2024 (USD MILLION)
- TABLE 129 EUROPE: E-FUELS MARKET, BY APPLICATION, 2025-2030 (USD MILLION)
- TABLE 130 EUROPE: E-FUELS MARKET, BY END USE, 2022-2024 (USD MILLION)
- TABLE 131 EUROPE: E-FUELS MARKET, BY END USE, 2025-2030 (USD MILLION)
- TABLE 132 EUROPE: E-FUELS MARKET, BY COUNTRY, 2022-2024 (USD MILLION)
- TABLE 133 EUROPE: E-FUELS MARKET, BY COUNTRY, 2025-2030 (USD MILLION)
- TABLE 134 GERMANY: E-FUELS MARKET, BY END USE, 2022-2024 (USD MILLION)
- TABLE 135 GERMANY: E-FUELS MARKET, BY END USE, 2025-2030 (USD MILLION)
- TABLE 136 NORWAY: E-FUELS MARKET, BY END USE, 2022-2024 (USD MILLION)
- TABLE 137 NORWAY: E-FUELS MARKET, BY END USE, 2025-2030 (USD MILLION)
- TABLE 138 UK: E-FUELS MARKET, BY END-USE, 2022-2024 (USD MILLION)
- TABLE 139 UK: E-FUELS MARKET, BY END-USE, 2025-2030 (USD MILLION)
- TABLE 140 DENMARK: E-FUELS MARKET, BY END USE, 2022-2024 (USD MILLION)
- TABLE 141 DENMARK: E-FUELS MARKET, BY END USE, 2025-2030 (USD MILLION)
- TABLE 142 SWEDEN: E-FUELS MARKET, BY END USE, 2022-2024 (USD MILLION)
- TABLE 143 SWEDEN: E-FUELS MARKET, BY END USE, 2025-2030 (USD MILLION)
- TABLE 144 REST OF EUROPE: E-FUELS MARKET, BY END USE, 2022-2024 (USD MILLION)
- TABLE 145 REST OF EUROPE: E-FUELS MARKET, BY END USE, 2025-2030 (USD MILLION)
- TABLE 146 ASIA PACIFIC: E-FUELS MARKET, BY STATE, 2022-2024 (USD MILLION)
- TABLE 147 ASIA PACIFIC: E-FUELS MARKET, BY STATE, 2025-2030 (USD MILLION)
- TABLE 148 ASIA PACIFIC: E-FUELS MARKET, BY TYPE, 2022-2024 (USD MILLION)
- TABLE 149 ASIA PACIFIC: E-FUELS MARKET, BY TYPE, 2025-2030 (USD MILLION)
- TABLE 150 ASIA PACIFIC: E-FUELS MARKET, BY TYPE, 2022-2024 (MILLION LITERS)
- TABLE 151 ASIA PACIFIC: E-FUELS MARKET, BY TYPE, 2025-2030 (MILLION LITERS)
- TABLE 152 ASIA PACIFIC: E-FUELS MARKET, BY APPLICATION, 2022-2024 (USD MILLION)
- TABLE 153 ASIA PACIFIC: E-FUELS MARKET, BY APPLICATION, 2025-2030 (USD MILLION)
- TABLE 154 ASIA PACIFIC: E-FUELS MARKET, BY END USE, 2022-2024 (USD MILLION)
- TABLE 155 ASIA PACIFIC: E-FUELS MARKET, BY END USE, 2025-2030 (USD MILLION)
- TABLE 156 ASIA PACIFIC: E-FUELS MARKET, BY COUNTRY, 2022-2024 (USD MILLION)
- TABLE 157 ASIA PACIFIC: E-FUELS MARKET, BY COUNTRY, 2025-2030 (USD MILLION)
- TABLE 158 CHINA: E-FUELS MARKET, BY END USE, 2022-2024 (USD MILLION)
- TABLE 159 CHINA: E-FUELS MARKET, BY END USE, 2025-2030 (USD MILLION)
- TABLE 160 AUSTRALIA: E-FUELS MARKET, BY END USE, 2022-2024 (USD MILLION)
- TABLE 161 AUSTRALIA: E-FUELS MARKET, BY END USE, 2025-2030 (USD MILLION)
- TABLE 162 INDIA: E-FUELS MARKET, BY END USE, 2022-2024 (USD MILLION)
- TABLE 163 INDIA: E-FUELS MARKET, BY END USE, 2025-2030 (USD MILLION)
- TABLE 164 REST OF ASIA PACIFIC: E-FUELS MARKET, BY END USE, 2022-2024 (USD MILLION)
- TABLE 165 REST OF ASIA PACIFIC: E-FUELS MARKET, BY END USE, 2025-2030 (USD MILLION)
- TABLE 166 NORTH AMERICA: E-FUELS MARKET, BY STATE, 2022-2024 (USD MILLION)
- TABLE 167 NORTH AMERICA: E-FUELS MARKET, BY STATE, 2025-2030 (USD MILLION)
- TABLE 168 NORTH AMERICA: E-FUELS MARKET, BY TYPE, 2022-2024 (USD MILLION)
- TABLE 169 NORTH AMERICA: E-FUELS MARKET, BY TYPE, 2025-2030 (USD MILLION)
- TABLE 170 NORTH AMERICA: E-FUELS MARKET, BY TYPE, 2022-2024 (MILLION LITERS)
- TABLE 171 NORTH AMERICA: E-FUELS MARKET, BY TYPE, 2025-2030 (MILLION LITERS)
- TABLE 172 NORTH AMERICA: E-FUELS MARKET, BY APPLICATION, 2022-2024 (USD MILLION)
- TABLE 173 NORTH AMERICA: E-FUELS MARKET, BY APPLICATION, 2025-2030 (USD MILLION)
- TABLE 174 NORTH AMERICA: E-FUELS MARKET, BY END USE, 2022-2024 (USD MILLION)
- TABLE 175 NORTH AMERICA: E-FUELS MARKET, BY END USE, 2025-2030 (USD MILLION)
- TABLE 176 NORTH AMERICA: E-FUELS MARKET, BY COUNTRY, 2022-2024 (USD MILLION)
- TABLE 177 NORTH AMERICA: E-FUELS MARKET, BY COUNTRY, 2025-2030 (USD MILLION)
- TABLE 178 US: E-FUELS MARKET, BY END USE, 2022-2024 (USD MILLION)
- TABLE 179 US: E-FUELS MARKET, BY END USE, 2025-2030 (USD MILLION)
- TABLE 180 CANADA: E-FUELS MARKET, BY END USE, 2022-2024 (USD MILLION)
- TABLE 181 CANADA: E-FUELS MARKET, BY END USE, 2025-2030 (USD MILLION)
- TABLE 182 ROW: E-FUELS MARKET, BY STATE, 2022-2024 (USD MILLION)
- TABLE 183 ROW: E-FUELS MARKET, BY STATE, 2025-2030 (USD MILLION)
- TABLE 184 ROW: E-FUELS MARKET, BY TYPE, 2022-2024 (USD MILLION)
- TABLE 185 ROW: E-FUELS MARKET, BY TYPE, 2025-2030 (USD MILLION)
- TABLE 186 ROW: E-FUELS MARKET, BY TYPE, 2022-2024 (MILLION LITERS)
- TABLE 187 ROW: E-FUELS MARKET, BY TYPE, 2025-2030 (MILLION LITERS)
- TABLE 188 ROW: E-FUELS MARKET, BY APPLICATION, 2022-2024 (USD MILLION)
- TABLE 189 ROW: E-FUELS MARKET, BY APPLICATION, 2025-2030 (USD MILLION)
- TABLE 190 ROW: E-FUELS MARKET, BY END USE, 2022-2024 (USD MILLION)
- TABLE 191 ROW: E-FUELS MARKET, BY END USE, 2025-2030 (USD MILLION)
- TABLE 192 ROW: E-FUELS MARKET, BY REGION, 2022-2024 (USD MILLION)
- TABLE 193 ROW: E-FUELS MARKET, BY REGION, 2025-2030 (USD MILLION)
- TABLE 194 MIDDLE EAST & AFRICA: E-FUELS MARKET, BY END USE, 2022-2024 (USD MILLION)
- TABLE 195 MIDDLE EAST & AFRICA: E-FUELS MARKET, BY END USE, 2025-2030 (USD MILLION)
- TABLE 196 SOUTH AMERICA: E-FUELS MARKET, BY END USE, 2022-2024 (USD MILLION)
- TABLE 197 SOUTH AMERICA: E-FUELS MARKET, BY END-USE, 2025-2030 (USD MILLION)
- TABLE 198 E-FUELS MARKET: OVERVIEW OF STRATEGIES ADOPTED BY KEY PLAYERS, JANUARY 2020-JULY 2025
- TABLE 199 E-FUELS MARKET: DEGREE OF COMPETITION, 2024
- TABLE 200 E-FUELS MARKET: REGION FOOTPRINT
- TABLE 201 E-FUELS MARKET: TYPE FOOTPRINT
- TABLE 202 E-FUELS MARKET: STATE FOOTPRINT
- TABLE 203 E-FUELS MARKET: APPLICATION FOOTPRINT
- TABLE 204 E-FUELS MARKET: END USE FOOTPRINT
- TABLE 205 E-FUELS MARKET: DETAILED LIST OF KEY STARTUPS/SMES
- TABLE 206 E-FUELS MARKET: COMPETITIVE BENCHMARKING OF KEY STARTUPS/SMES
- TABLE 207 E-FUELS MARKET: DEALS, JANUARY 2020-JULY 2025
- TABLE 208 E-FUELS MARKET: EXPANSIONS, JANUARY 2020-JULY 2025
- TABLE 209 E-FUELS MARKET: OTHER DEVELOPMENTS, JANUARY 2020-JULY 2025
- TABLE 210 SAUDI ARABIAN OIL CO.: COMPANY OVERVIEW
- TABLE 211 SAUDI ARABIAN OIL CO.: PRODUCTS/SOLUTIONS/SERVICES OFFERED
- TABLE 212 SAUDI ARABIAN OIL CO.: DEALS
- TABLE 213 AUDI AG: COMPANY OVERVIEW
- TABLE 214 AUDI AG: PRODUCTS/SOLUTIONS/SERVICES OFFERED
- TABLE 215 REPSOL: COMPANY OVERVIEW
- TABLE 216 REPSOL: PRODUCTS/SOLUTIONS/SERVICES OFFERED
- TABLE 217 REPSOL: DEALS
- TABLE 218 REPSOL: EXPANSIONS
- TABLE 219 REPSOL: OTHER DEVELOPMENTS
- TABLE 220 SUNFIRE SE: COMPANY OVERVIEW
- TABLE 221 SUNFIRE SE: PRODUCTS/SOLUTIONS/SERVICES OFFERED
- TABLE 222 SUNFIRE SE: DEALS
- TABLE 223 ELECTROCHAEA GMBH: COMPANY OVERVIEW
- TABLE 224 ELECTROCHAEA GMBH: PRODUCTS/SOLUTIONS/SERVICES OFFERED
- TABLE 225 ELECTROCHAEA GMBH: DEALS
- TABLE 226 ELECTROCHAEA GMBH: EXPANSIONS
- TABLE 227 UNIPER SE: COMPANY OVERVIEW
- TABLE 228 UNIPER SE: PRODUCTS/SOLUTIONS/SERVICES OFFERED
- TABLE 229 UNIPER SE: DEALS
- TABLE 230 UNIPER SE: OTHER DEVELOPMENTS
- TABLE 231 ORSTED A/S: COMPANY OVERVIEW
- TABLE 232 ORSTED A/S: PRODUCTS/SOLUTIONS/SERVICES OFFERED
- TABLE 233 ORSTED A/S: DEALS
- TABLE 234 YARA: COMPANY OVERVIEW
- TABLE 235 YARA: PRODUCTS/SOLUTIONS/SERVICES OFFERED
- TABLE 236 YARA: DELAS
- TABLE 237 YARA: EXPANSIONS
- TABLE 238 PERSTORP: COMPANY OVERVIEW
- TABLE 239 PERSTORP: PRODUCTS/SOLUTIONS/SERVICES OFFERED
- TABLE 240 PERSTORP: DEALS
- TABLE 241 PERSTORP: EXPANSIONS
- TABLE 242 PERSTORP: OTHER DEVELOPMENTS
- TABLE 243 HIF GLOBAL: COMPANY OVERVIEW
- TABLE 244 HIF GLOBAL: PRODUCTS/SOLUTIONS/SERVICES OFFERED
- TABLE 245 HIF GLOBAL: DEALS
- TABLE 246 HIF GLOBAL: OTHER DEVELOPMENTS
- TABLE 247 INFINIUM: COMPANY OVERVIEW
- TABLE 248 INFINIUM: PRODUCTS/SOLUTIONS/SERVICES OFFERED
- TABLE 249 INFINIUM: DEALS
- TABLE 250 INFINIUM: EXPANSIONS
- TABLE 251 INFINIUM: OTHER DEVELOPMENTS
- TABLE 252 INERATEC GMBH: COMPANY OVERVIEW
- TABLE 253 INERATEC GMBH: PRODUCTS/SOLUTIONS/SERVICES OFFERED
- TABLE 254 INERATEC GMBH: DEALS
- TABLE 255 INERATEC GMBH: EXPANSIONS
- TABLE 256 INERATEC GMBH: OTHER DEVELOPMENTS
- TABLE 257 LIQUID WIND: COMPANY OVERVIEW
- TABLE 258 LIQUID WIND: PRODUCTS/SOLUTIONS/SERVICES OFFERED
- TABLE 259 LIQUID WIND: DEALS
- TABLE 260 LIQUID WIND: EXPANSIONS
- TABLE 261 NORSK E-FUEL: COMPANY OVERVIEW
- TABLE 262 NORSK E-FUEL: PRODUCTS/SOLUTIONS/SERVICES OFFERED
- TABLE 263 NORSK E-FUEL: DEALS
- TABLE 264 NORDIC ELECTROFUEL: COMPANY OVERVIEW
- TABLE 265 NORDIC ELECTROFUEL: PRODUCTS/SOLUTIONS/SERVICES OFFERED
- TABLE 266 NORDIC ELECTROFUEL: DEALS
- TABLE 267 NORDIC ELECTROFUEL: EXPANSIONS
- TABLE 268 NORDIC ELECTROFUEL: OTHER DEVELOPMENTS
- TABLE 269 EUROPEAN ENERGY: COMPANY OVERVIEW
- TABLE 270 EUROPEAN ENERGY: PRODUCTS/SOLUTIONS/SERVICES OFFERED
- TABLE 271 EUROPEAN ENERGY: DEALS
- TABLE 272 EUROPEAN ENERGY: EXPANSIONS
- TABLE 273 CARBON RECYCLING INTERNATIONAL: COMPANY OVERVIEW
- TABLE 274 SYNHELION AG: COMPANY OVERVIEW
- TABLE 275 ARCADIA EFUELS: COMPANY OVERVIEW
- TABLE 276 SKKYNRG: COMPANY OVERVIEW
- TABLE 277 NATRAN: COMPANY OVERVIEW
- TABLE 278 SKOVGAARD ENERGY: COMPANY OVERVIEW
- TABLE 279 NESTE: COMPANY OVERVIEW
- TABLE 280 TURN2X: COMPANY OVERVIEW
- TABLE 281 P2X-EUROPE GMBH & CO. KG: COMPANY OVERVIEW
List of Figures
- FIGURE 1 E-FUELS MARKET SEGMENTATION AND REGIONAL SCOPE
- FIGURE 2 DURATION CONSIDERED
- FIGURE 3 E-FUELS MARKET: RESEARCH DESIGN
- FIGURE 4 DATA CAPTURED FROM SECONDARY SOURCES
- FIGURE 5 CORE FINDINGS FROM INDUSTRY EXPERTS
- FIGURE 6 BREAKDOWN OF PRIMARY INTERVIEWS, BY COMPANY TYPE, DESIGNATION, AND REGION
- FIGURE 7 E-FUELS MARKET: BOTTOM-UP APPROACH
- FIGURE 8 E-FUELS MARKET: DEMAND-SIDE ANALYSIS
- FIGURE 9 E-FUELS MARKET: TOP-DOWN APPROACH
- FIGURE 10 KEY METRICS CONSIDERED TO ASSESS SUPPLY OF E-FUELS
- FIGURE 11 E-FUELS MARKET: SUPPLY-SIDE ANALYSIS
- FIGURE 12 INDUSTRY CONCENTRATION, 2024
- FIGURE 13 E-FUELS MARKET: DATA TRIANGULATION
- FIGURE 14 E-FUELS MARKET: RESEARCH LIMITATIONS
- FIGURE 15 LIQUID (POWER-TO-LIQUID) SEGMENT TO HOLD LARGER MARKET SHARE IN 2025
- FIGURE 16 E-AMMONIA TO RECORD HIGHEST CAGR IN E-FUELS MARKET FROM 2025 TO 2030
- FIGURE 17 FUEL SEGMENT TO DOMINATE E-FUELS MARKET BETWEEN 2025 AND 2030
- FIGURE 18 TRANSPORTATION SEGMENT TO HOLD LARGEST MARKET SHARE IN 2030
- FIGURE 19 EUROPE CAPTURED LARGEST SHARE OF E-FUELS MARKET IN 2024
- FIGURE 20 SUPPORTIVE REGULATORY FRAMEWORK TO MEET CLIMATE GOALS TO DRIVE E-FUELS MARKET
- FIGURE 21 ASIA PACIFIC TO RECORD HIGHEST CAGR DURING FORECAST PERIOD
- FIGURE 22 LIQUID (POWER-TO-LIQUID) SEGMENT TO HOLD LARGER MARKET SHARE IN 2030
- FIGURE 23 E-AMMONIA SEGMENT TO CAPTURE LARGEST SHARE OF E-FUELS MARKET IN 2030
- FIGURE 24 FUEL SEGMENT TO HOLD LARGER SHARE OF E-FUELS MARKET IN 2030
- FIGURE 25 TRANSPORTATION SEGMENT TO ACCOUNT FOR LARGEST MARKET SHARE IN 2030
- FIGURE 26 GASEOUS (POWER-TO-GAS) SEGMENT AND GERMANY HELD LARGEST SHARES OF E-FUELS MARKET IN EUROPE IN 2024
- FIGURE 27 DRIVERS, RESTRAINTS, OPPORTUNITIES, AND CHALLENGES
- FIGURE 28 GREEN HYDROGEN PRODUCTION IN EUROPE, 2023
- FIGURE 29 GLOBAL SALES OF BATTERY ELECTRIC VEHICLES (BEVS), 2020-2024
- FIGURE 30 TRENDS/DISRUPTIONS IMPACTING CUSTOMER BUSINESS
- FIGURE 31 E-FUELS SUPPLY CHAIN
- FIGURE 32 E-FUELS ECOSYSTEM
- FIGURE 33 PATENTS APPLIED AND GRANTED, 2015-2024
- FIGURE 34 AVERAGE SELLING PRICE TREND OF E-FUELS, BY TYPE, 2022-2024
- FIGURE 35 AVERAGE SELLING PRICE TREND OF E-FUELS, BY REGION, 2022-2024
- FIGURE 36 IMPORT DATA FOR HS CODE 2814-COMPLIANT PRODUCTS FOR TOP FIVE COUNTRIES, 2020-2024
- FIGURE 37 EXPORT DATA FOR HS CODE 2814-COMPLIANT PRODUCTS FOR TOP FIVE COUNTRIES, 2020-2024
- FIGURE 38 PORTER'S FIVE FORCES ANALYSIS
- FIGURE 39 INFLUENCE OF KEY STAKEHOLDERS ON BUYING PROCESS FOR TOP THREE END USES
- FIGURE 40 KEY BUYING CRITERIA FOR TOP THREE END USES
- FIGURE 41 INVESTMENT AND FUNDING SCENARIO, 2020-2024
- FIGURE 42 IMPACT OF AI/GEN AI ON E-FUEL SUPPLY CHAIN, BY REGION
- FIGURE 43 E-FUEL PRODUCTION PROCESS USING RENEWABLE SOURCES
- FIGURE 44 E-FUELS MARKET SHARE, BY TYPE, 2024
- FIGURE 45 E-FUELS MARKET SHARE, BY STATE, 2024
- FIGURE 46 E-FUELS MARKET SHARE, BY APPLICATION, 2024
- FIGURE 47 E-FUELS MARKET SHARE, BY END USE, 2024
- FIGURE 48 ASIA PACIFIC TO BE FASTEST-GROWING REGION DURING FORECAST PERIOD
- FIGURE 49 EUROPE: E-FUELS MARKET SNAPSHOT
- FIGURE 50 ASIA PACIFIC: E-FUELS MARKET SNAPSHOT
- FIGURE 51 E-FUELS MARKET: REVENUE ANALYSIS OF KEY PLAYERS, 2020-2024
- FIGURE 52 MARKET SHARE ANALYSIS OF COMPANIES OFFERING E-FUELS, 2024
- FIGURE 53 COMPANY VALUATION
- FIGURE 54 FINANCIAL METRICS
- FIGURE 55 PRODUCT COMPARISON
- FIGURE 56 E-FUELS MARKET: COMPANY EVALUATION MATRIX (KEY PLAYERS), 2024
- FIGURE 57 E-FUELS MARKET: COMPANY FOOTPRINT
- FIGURE 58 E-FUELS MARKET: COMPANY EVALUATION MATRIX (STARTUPS/SMES), 2024
- FIGURE 59 SAUDI ARABIAN OIL CO.: COMPANY SNAPSHOT
- FIGURE 60 AUDI AG: COMPANY SNAPSHOT
- FIGURE 61 REPSOL: COMPANY SNAPSHOT
- FIGURE 62 UNIPER SE: COMPANY SNAPSHOT
- FIGURE 63 ORSTED A/S: COMPANY SNAPSHOT
- FIGURE 64 YARA: COMPANY SNAPSHOT
- FIGURE 65 EUROPEAN ENERGY COMPANY SNAPSHOT

