
PUBLISHER: Mordor Intelligence | PRODUCT CODE: 1850299

PUBLISHER: Mordor Intelligence | PRODUCT CODE: 1850299
Vertical Farming - Market Share Analysis, Industry Trends & Statistics, Growth Forecasts (2025 - 2030)
The Vertical Farming Market size is estimated at USD 6.70 billion in 2025 and is projected to reach USD 16.88 billion by 2030, at a CAGR of 20.30% during the forecast period.
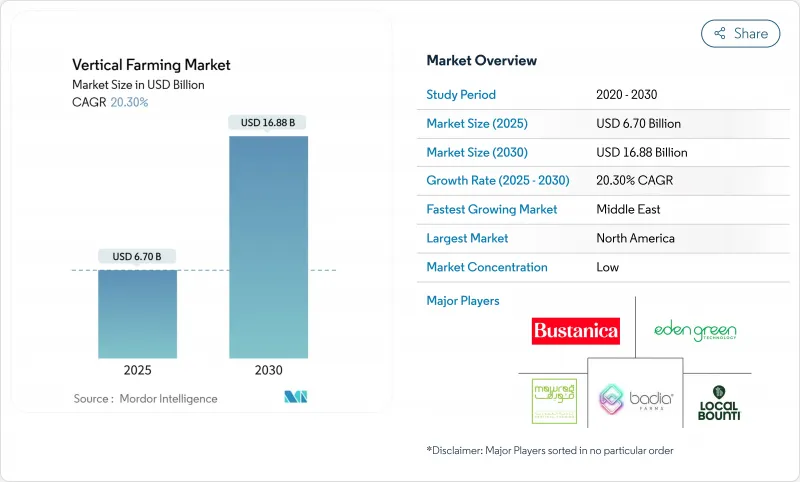
Robust expansion stems from tightening urban land availability, technological cost deflation, and rising institutional investment. North America retained leadership with a 39.1% revenue share in 2024, but the Middle East posts the fastest 15.5% CAGR through 2030 as food-security programs finance mega-facilities. Hydroponics held 57.1% of production value, while aeroponics outpaced at 24.1% CAGR thanks to superior yield-per-foot economics. Lighting accounted for the largest 38.5% capital outlay, yet climate-control systems show the quickest 20.2% growth as operators sharpen energy efficiency. Competition remains fragmented, with top-five vendors controlling over 20% of 2024 revenue, leaving ample room for specialized entrants and regional champions.
Global Vertical Farming Market Trends and Insights
Urbanization-driven demand for local fresh produce
Global urban residency is on track to reach 70% by 2050, intensifying pressure on metropolitan food logistics. Operators such as Eden Green deliver lettuce from harvest to shelf within 48 hours, cutting transport routes from thousands of miles to within city limits while using 99% less land and 98% less water. Singapore's "30 by 30" strategy illustrates national-level adoption, and solar-powered indoor farms are scaling to supply one-third of the city-state's nutritional needs by 2030.
LED, automation, and AI cost-down curve
Lighting now represents the single largest controllable expense. Cornell University trials lowered lettuce energy demand from 9.5 kilowatt-hours per kilogram to 6.42 kilowatt-hours per kilogram. Using spectrum-tuned LEDs and AI scheduling. Siemens and 80 Acres Farms further display how digital twins and robotics standardize workflows across global footprints.
High energy intensity and capex
Electricity absorbs 50-65% of operating budgets, trials record 12.5 kilowatt-hours per kilogram of lettuce, pressuring margins where grid tariffs exceed United States dollars 0.12 per kilowatt-hour. Light-emitting diodes now average 3.2 micromoles per joule, up from 2.5 micromoles per joule in 2023, and artificial intelligence-orchestrated heating, ventilation, and air conditioning trims another 25% load. Yet, container retrofits, while cheaper upfront at USD 15,000-20,000, struggle with poorer thermal mass and, thus, higher per-unit energy cost.
Other drivers and restraints analyzed in the detailed report include:
- Climate-resilient food systems amid extreme weather
- Government incentives and ag-tech investments
- Skill gap and operational complexity
For complete list of drivers and restraints, kindly check the Table Of Contents.
Segment Analysis
Hydroponics commanded 57.1% of the vertical farming market in 2024. Proven nutrient recipes, scalable hardware supply, and straightforward system maintenance keep it the first choice for large retailers. Aeroponics, growing at 24.1% CAGR, atomizes water into a fine mist, accelerating biomass by up to 30% and saving 95% water. The vertical farming market size for aeroponics is forecast to climb briskly alongside rising berry and vine-crop adoption. Despite lower current penetration, aquaponics creates symbiotic fish-and-vegetable revenue streams that hedge price volatility.
Commercial evaluations weigh capital intensity against throughput. Hydroponic rails cost USD 80-100 per square meter, while aeroponic towers exceed USD 140 but return faster cycles. Data-driven fertigation is narrowing this gap, and some operators hybridize both methods within the same facility. Insurance underwriters increasingly favor aeroponic redundancy because misting nozzles isolates root disease outbreaks, reducing recall exposure.
Buildings held 61.3% of 2024 revenue, reflecting supermarket-scale volumes and the ability to integrate rooftop solar or co-located waste-heat recovery. Container farms, though only a fraction, rose at 23.5% CAGR as universities, hospitals, and corporate campuses purchased turnkey modules. Freight Farms noted a 32% uptick in orders from nonprofits during 2024.
Economics diverges over asset life. Buildings amortize over 20-25 years and qualify for green-bond financing, containers depreciate in seven years and endure higher per-pound utility costs. Nevertheless, disaster-relief agencies value container mobility, dispatching units within 30 days after extreme weather knocks out supply chains.
The Vertical Farming Market Report is Segmented by Growth Mechanism (Hydroponics, Aeroponics, and Aquaponics), by Structure (Buidling-Based Vertical Farms and More), by Components (Lightning, Sensors, Climate Control, and More), by Crop (Tomato, Berries, Pepper, Cucumber, and More), and by Geography (North America, South America, Asia-Pacific, Europe, and More). The Market Forecasts are Provided in Terms of Value (USD).
Geography Analysis
North America remained the largest regional contributor, delivering 39.1% of 2024 revenue. USDA grants, retailer partnerships, and consumer willingness to pay a 20-30% premium for local greens underpin momentum. U.S. facilities, such as a USD 56 million, 30,000-square-meter complex in Georgia, illustrate how brownfield warehouses convert into year-round suppliers. Canada's GoodLeaf leverages hydroelectric tariffs to maintain a competitive cost of goods.
The Middle East is the vertical farming market's fastest region, expanding at 15.5% CAGR. Sovereign funds finance large enclosures to bolster food security amid arid climates. ECO-1 in Dubai, the world's largest vertical farm, now produces more than 2 million lb of leafy greens each year, and the UAE plans 500 additional sites by 2030. Systems here are frequently coupled with desalination plants, using waste heat and brine mineral streams to enhance resource efficiency.
Asia-Pacific shows mixed signals. Singapore accelerates solar-integrated towers to meet its "30 by 30" target, whereas several ventures in Malaysia shut down due to high electricity tariffs. China's state-backed institutes focus on multi-story greenhouse hybrids rather than full indoor builds. Europe faces zoning hurdles and high construction costs, yet Dutch greenhouse operators attract private equity funding. South America is emergent: Chile's AgroUrbana closed USD 6 million to quintuple capacity, and Mexican operators scale container clusters to serve resort corridors.
- Mowreq Specialized Agriculture Company
- GoodLeaf Farms (TruLeaf)
- Local Bounti Corporation
- Arable Grow
- Badia Farms
- 80 Acres Urban Agriculture Inc.
- Eden Green Technology
- Emirates Bustanica
Additional Benefits:
- The market estimate (ME) sheet in Excel format
- 3 months of analyst support
TABLE OF CONTENTS
1 Introduction
- 1.1 Study Assumptions and Market Definition
- 1.2 Scope of the Study
2 Research Methodology
3 Executive Summary
4 Market Landscape
- 4.1 Market Overview
- 4.2 Market Drivers
- 4.2.1 Urbanization-driven demand for local fresh produce
- 4.2.2 LED, automation, and AI cost-down curve
- 4.2.3 Climate-resilient food systems amid extreme weather
- 4.2.4 Government incentives and Ag-tech investments
- 4.2.5 Carbon-credit revenue stacking for VF operators
- 4.2.6 Corporate ESG on-site micro-farm installations
- 4.3 Market Restraints
- 4.3.1 High energy intensity and capex
- 4.3.2 Narrow crop portfolio profitability window
- 4.3.3 Skill gap and operational complexity
- 4.3.4 Unclear GMO micro-green regulatory pathway
- 4.4 Regulatory Landscape
- 4.5 Technological Outlook
- 4.6 Porters Five Forces
- 4.6.1 Bargaining Power of Suppliers
- 4.6.2 Bargaining Power of Buyers
- 4.6.3 Threat of New Entrants
- 4.6.4 Threat of Substitutes
- 4.6.5 Intensity of Competitive Rivalry
5 Market Size and Growth Forecasts (Value, USD)
- 5.1 By Growth Mechanism
- 5.1.1 Hydroponics
- 5.1.2 Aeroponics
- 5.1.3 Aquaponics
- 5.2 By Structure
- 5.2.1 Building-based Vertical Farms
- 5.2.2 Shipping-Container-based Vertical Farms
- 5.3 By Components
- 5.3.1 Lighting
- 5.3.2 Climate Control
- 5.3.3 Sensors
- 5.3.4 Other Hydroponic Components (nutrient dosing systems, inert grow media, etc.)
- 5.4 By Crop
- 5.4.1 Tomato
- 5.4.2 Berries
- 5.4.3 Lettuce and Leafy Greens
- 5.4.4 Pepper
- 5.4.5 Cucumber
- 5.4.6 Microgreens
- 5.4.7 Other Crops (spinach, culinary herbs, etc.)
- 5.5 By Geography
- 5.5.1 North America
- 5.5.1.1 United States
- 5.5.1.2 Canada
- 5.5.1.3 Mexico
- 5.5.1.4 Rest of North America
- 5.5.2 Europe
- 5.5.2.1 United Kingdom
- 5.5.2.2 France
- 5.5.2.3 Sweden
- 5.5.2.4 Rest of Europe
- 5.5.3 Asia-Pacific
- 5.5.3.1 Singapore
- 5.5.3.2 China
- 5.5.3.3 Japan
- 5.5.3.4 Taiwan
- 5.5.3.5 Rest of Asia-Pacific
- 5.5.4 Middle East
- 5.5.4.1 United Arab Emirates
- 5.5.4.2 Saudi Arabia
- 5.5.4.3 Israel
- 5.5.4.4 Rest of Middle East
- 5.5.5 Africa
- 5.5.5.1 South Africa
- 5.5.5.2 Kenya
- 5.5.5.3 Rest of Africa
- 5.5.1 North America
6 Competitive Landscape
- 6.1 Market Concentration
- 6.2 Strategic Moves
- 6.3 Market Share Analysis
- 6.4 Company Profiles (includes Global level Overview, Market level overview, Core Segments, Financials as available, Strategic Information, Market Rank/Share for key companies, Products and Services, and Recent Developments)
- 6.4.1 Mowreq Specialized Agriculture Company
- 6.4.2 GoodLeaf Farms (TruLeaf)
- 6.4.3 Local Bounti Corporation
- 6.4.4 Arable Grow
- 6.4.5 Badia Farms
- 6.4.6 80 Acres Urban Agriculture Inc.
- 6.4.7 Eden Green Technology
- 6.4.8 Emirates Bustanica
7 Market Opportunities and Future Outlook

