
PUBLISHER: Mordor Intelligence | PRODUCT CODE: 1906177

PUBLISHER: Mordor Intelligence | PRODUCT CODE: 1906177
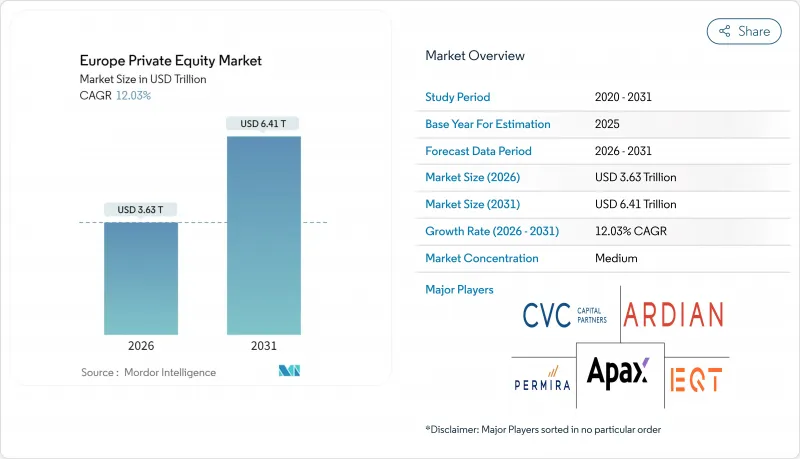
Europe Private Equity - Market Share Analysis, Industry Trends & Statistics, Growth Forecasts (2026 - 2031)
Europe private equity market size in 2026 is estimated at USD 3.63 trillion, growing from 2025 value of USD 3.24 trillion with 2031 projections showing USD 6.41 trillion, growing at 12.03% CAGR over 2026-2031.
A blend of strong dry-powder deployment pressure, regulatory moves toward sustainable finance, faster digital adoption after the pandemic, and innovative exit tools such as continuation vehicles underpins this expansion. Buyout managers still dominate deal flow, yet secondary and continuation strategies gain traction as institutional investors seek liquidity without exiting the asset class. Technology retains the largest industry allocation while healthcare accelerates fastest, both benefiting from macro themes of digitization and population ageing. At the same time, the United Kingdom keeps its lead in capital raised and deals closed, even as Spain posts the highest forward growth rate due to pro-investment reforms and solid GDP momentum. Competitive intensity rises as mega-managers consolidate assets, but mid-market specialists stay relevant by targeting fragmented European SME niches.
Europe Private Equity Market Trends and Insights
Persistent Dry-Powder Overhang and LP Pressure to Deploy Capital
European limited partners now hold unprecedented uncalled commitments, which fuel steady deal activity despite cyclical headwinds. Fundraising reached USD 118.8 billion in the first three quarters of 2024, almost matching the prior year total as pension plans and sovereign funds raised their allocation targets. Average holding periods stretch to 6.7 years, intensifying the need for larger tickets and off-market sourcing to absorb capital. Managers compete for scarce high-quality assets, often agreeing to higher entry multiples while concurrently designing ambitious operational-value plans to sustain returns. This behavior supports near-term growth in the Europe private equity market.
EU Green Deal Incentives Steering PE Toward Sustainability-Linked Assets
The Sustainable Finance Disclosure Regulation pushes Article 8 and 9 funds to nearly two-thirds of Europe's fund launches. Private equity houses embed ESG targets directly into carried-interest hurdles, aligning teams with emissions-reduction or diversity metrics. The Corporate Sustainability Reporting Directive demands extensive disclosures, raising compliance costs for smaller managers yet rewarding early movers with access to larger pools of capital. Green-tilted deals in renewables, resource-efficient manufacturing, and circular business models regularly command premium exit valuations, pulling fresh capital into the Europe private equity market.
Valuation Reset Amid Higher Interest Rates Compressing Exit Multiples
European Central Bank rate hikes raise discount rates and debt service costs, trimming equity valuations for levered businesses. Lower-growth industrial assets suffer the largest multiple compression, compelling sponsors to lean more on revenue and margin expansion rather than financial engineering. Private debt funds step in to bridge financing gaps, but pricing still trails the record-low coupons of the pre-2022 cycle. This environment weighs on exit proceeds and temporarily tempers expansion momentum in the Europe private equity market.
Other drivers and restraints analyzed in the detailed report include:
- Digital-First Business Models Scaling Rapidly in Post-COVID Europe
- Secondary Buyout Wave Driven by Fund-to-Fund Trades
- Regulatory Scrutiny on "National Champions" Deals Delaying Approvals
For complete list of drivers and restraints, kindly check the Table Of Contents.
Segment Analysis
Buyout funds controlled 55.78% of the Europe private equity market in 2025, attracting institutional investors that value strong governance rights and cash flow predictability. Yet, secondaries and fund-of-funds log a 12.17% CAGR to 2031, fueled by record LP demand for liquidity. Continuation funds now comprise 84% of GP-led secondary volume, a structure that extends hold periods without forgoing upside. Main Capital's USD 603 million software vehicle and Corsair's USD 600 million fintech continuation fund illustrate this shift. The Europe private equity market size for secondaries is therefore poised to widen materially.
Ongoing regulatory clarity under AIFMD II and the expansion of specialist secondary managers broaden the investor base. Pension boards allocate more to these strategies to smooth cash-flow profiles and dampen vintage-year risk, gradually nudging market share away from pure buyout pools. Even so, flagship buyout franchises retain scale advantages in sourcing and portfolio support, defending their lead in the Europe private equity market.
The Europe Private Equity Market is Segmented by Fund Type (Buyout and Growth, Venture Capital, Mezzanine, and More), Sector (Technology, Healthcare, Real Estate, Financial Services, Industrials, Telecom, and More), Investments (Large Cap, Upper-Middle Market, and More), and Country (United Kingdom, Germany, France, Sweden, Italy, Spain, Netherlands and More). The Market Forecasts are Provided in Terms of Value (USD).
List of Companies Covered in this Report:
- EQT
- CVC Capital Partners
- Permira
- Apax Partners
- Ardian
- Bridgepoint Group
- Cinven
- HgCapital
- Partners Group
- BC Partners
- Nordic Capital
- 3i Group
- Bain Capital
- Silver Lake
- KKR
- Oakley Capital
- Antin Infrastructure Partners
- IK Partners
- Sofinnova Partners
- SoftBank Vision Fund
Additional Benefits:
- The market estimate (ME) sheet in Excel format
- 3 months of analyst support
TABLE OF CONTENTS
1 Introduction
- 1.1 Study Assumptions & Market Definition
- 1.2 Scope of the Study
2 Research Methodology
3 Executive Summary
4 Market Landscape
- 4.1 Market Overview
- 4.2 Market Drivers
- 4.2.1 Persistent dry-powder overhang and LP pressure to deploy capital
- 4.2.2 EU Green Deal incentives steering PE toward sustainability-linked assets
- 4.2.3 Digital-first business models scaling rapidly in post-COVID Europe
- 4.2.4 Secondary buyout wave driven by fund-to-fund trades
- 4.2.5 Niche funds targeting succession in Mittelstand family businesses
- 4.2.6 Surge in GP-led continuation vehicles unlocking trapped value
- 4.3 Market Restraints
- 4.3.1 Valuation reset amid higher interest rates compressing exit multiples
- 4.3.2 Regulatory scrutiny on 'national champions' deals delaying approvals
- 4.3.3 Fund-level ESG disclosure costs squeezing smaller GPs (under-reported)
- 4.3.4 Talent crunch in operational value-creation teams (under-reported)
- 4.4 Value / Supply-Chain Analysis
- 4.5 Regulatory Landscape
- 4.6 Technological Outlook
- 4.7 Porter's Five Forces
- 4.7.1 Threat of New Entrants
- 4.7.2 Bargaining Power of Buyers
- 4.7.3 Bargaining Power of Suppliers
- 4.7.4 Threat of Substitutes
- 4.7.5 Intensity of Competitive Rivalry
- 4.8 Macroeconomic & Geopolitical Impact Analysis
5 Market Size & Growth Forecasts
- 5.1 By Fund Type
- 5.1.1 Buyout & Growth
- 5.1.2 Venture Capital
- 5.1.3 Mezzanine & Distressed
- 5.1.4 Secondaries & Fund of Funds
- 5.2 By Sector
- 5.2.1 Technology (Software)
- 5.2.2 Healthcare
- 5.2.3 Real Estate and Services
- 5.2.4 Financial Services
- 5.2.5 Industrials
- 5.2.6 Consumer & Retail
- 5.2.7 Energy & Power
- 5.2.8 Media & Entertainment
- 5.2.9 Telecom
- 5.2.10 Others (Transportation, etc.)
- 5.3 By Investments
- 5.3.1 Large Cap
- 5.3.2 Upper Middle Market
- 5.3.3 Lower Middle Market
- 5.3.4 Small & SMID
- 5.4 By Country
- 5.4.1 United Kingdom
- 5.4.2 Germany
- 5.4.3 France
- 5.4.4 Sweden
- 5.4.5 Italy
- 5.4.6 Spain
- 5.4.7 Netherlands
- 5.4.8 Rest of Europe
6 Competitive Landscape
- 6.1 Market Concentration
- 6.2 Strategic Moves
- 6.3 Market Share Analysis
- 6.4 Company Profiles (includes Global level Overview, Market level overview, Core Segments, Financials as available, Strategic Information, Market Rank/Share for key companies, Products & Services, and Recent Developments)
- 6.4.1 EQT
- 6.4.2 CVC Capital Partners
- 6.4.3 Permira
- 6.4.4 Apax Partners
- 6.4.5 Ardian
- 6.4.6 Bridgepoint Group
- 6.4.7 Cinven
- 6.4.8 HgCapital
- 6.4.9 Partners Group
- 6.4.10 BC Partners
- 6.4.11 Nordic Capital
- 6.4.12 3i Group
- 6.4.13 Bain Capital
- 6.4.14 Silver Lake
- 6.4.15 KKR
- 6.4.16 Oakley Capital
- 6.4.17 Antin Infrastructure Partners
- 6.4.18 IK Partners
- 6.4.19 Sofinnova Partners
- 6.4.20 SoftBank Vision Fund
7 Market Opportunities & Future Outlook
- 7.1 White-space & Unmet-Need Assessment

