
PUBLISHER: Mordor Intelligence | PRODUCT CODE: 1911294

PUBLISHER: Mordor Intelligence | PRODUCT CODE: 1911294
Japan Power - Market Share Analysis, Industry Trends & Statistics, Growth Forecasts (2026 - 2031)
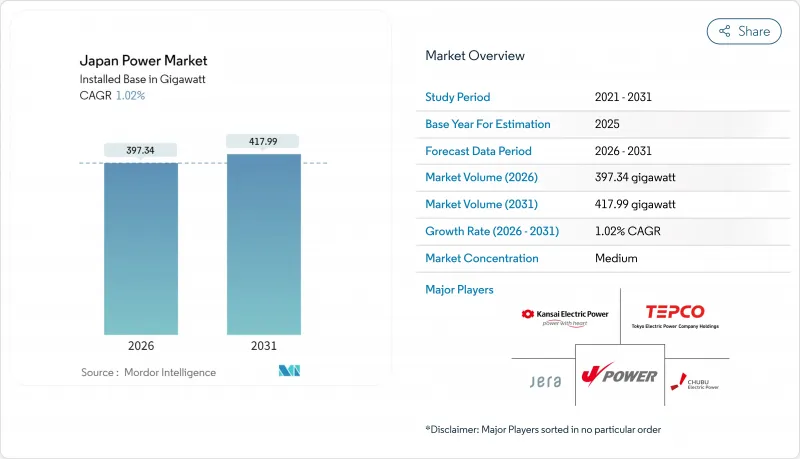
Japan Power Market size in 2026 is estimated at 397.34 gigawatt, growing from 2025 value of 393.33 gigawatt with 2031 projections showing 417.99 gigawatt, growing at 1.02% CAGR over 2026-2031.
Steady headline growth conceals structural change: policy now channels the USD 1 trillion Green Transformation (GX) budget into renewable build-out, nuclear restarts, and high-voltage direct-current (HVDC) interties that knit the historically fragmented 50 Hz/60 Hz grids into one commercial arena. Declining solar photovoltaic (PV) costs, offshore wind auction momentum, and accelerating grid-scale battery storage sharpen competitive pressure on legacy liquefied natural gas (LNG) plants, while hydrogen and ammonia co-firing pilots begin hedging fuel-price risk. Energy Storage News. At the same time, Japan's Cabinet now targets a 40-50% renewable share and a 20% nuclear contribution by 2040 to secure supply for energy-intensive semiconductor and artificial-intelligence clusters. Corporate power-purchase agreements (PPAs), smart-meter data analytics, and demand-response programs amplify these shifts by monetizing grid flexibility in urban corridors where consumption peaks persist despite population decline.
Japan Power Market Trends and Insights
Declining PV Module & Installation Costs
Module prices fell from 17.6 yen/kWh in 2018 to below 8 yen/kWh for several 2024 bids, letting solar compete in wholesale markets without subsidies. Hardware deflation and streamlined soft costs now move the technology from feed-in-tariff reliance toward auction-based price discovery. This cost curve dovetails with rooftop and agrivoltaic deployment that circumvents land scarcity. Manufacturers such as Murata locked 70 MW through virtual PPAs to meet RE100 goals, anchoring demand in industrial corridors. As battery prices drop, midday solar peaks increasingly shift into evening demand, eroding peaking-plant margins and reshaping capacity-market dynamics.
Offshore Wind Auction Pipeline Expansion
Round-3 tenders in December 2024 awarded 1 GW at JPY 3/kWh, confirming cost parity with conventional generation. Floating foundations unlock deeper waters and sidestep coastal depth constraints, with JERA-led groups targeting typhoon-resilient platforms. Government grid-reservation directives now coordinate seabed leases with transmission build-outs, mitigating a historic bottleneck. European developers transfer harsh-environment know-how, while Japanese trading houses supply project finance in a hybrid model that builds domestic supply chains. Resolution of fishing-industry consultations and port-infrastructure upgrades will decide whether the sector can hit the 10 GW by 2030 milestone.
LNG Price Volatility & Import Reliance
Japan imports 96% of its energy, so LNG spot surges once drove day-ahead power prices above USD 1/kWh, compressing utility margins. Although nuclear restarts cut LNG burn 25% since 2014, residual dependency persists. Trading houses now resell contracted cargoes abroad, signalling structural demand erosion, while Kyushu Electric pursues upstream stakes in US export terminals to hedge volatility. Co-firing ammonia or hydrogen is under trial but lacks commercial scale.
Other drivers and restraints analyzed in the detailed report include:
- Nuclear Reactor Restarts Under GX Policy
- Grid-Scale Battery Storage Cost Declines
- Limited On-Shore Land for Utility Solar
For complete list of drivers and restraints, kindly check the Table Of Contents.
Segment Analysis
The renewables slice of the Japan power market size climbed to 40.05% in 2025 and is tracking a 3.72% CAGR through 2031 as solar and offshore wind scale rapidly. Solar alone reached 91 GW cumulative capacity, bolstered by low module prices and merchant PPA uptake. Offshore wind holds just 0.3 GW of operating assets but 10 GW of government-backed targets by 2030 and up to 45 GW by 2040, setting the stage for the fastest absolute growth among resources. Geothermal and biomass remain niche due to permitting limits and imported feedstock costs.
Thermal generation defended 51.80% Japan's power market share in 2025, yet escalating carbon prices and ammonia co-firing mandates pressure long-term economics. JERA's pilot at the 4.1 GW Hekinan coal plant blends 20% ammonia, and government policy seeks fleet-wide adoption by 2030, requiring 3 million t of annual imports. Nuclear restarts added 826 MW in 2024 and will climb toward the 20% generation share goal if community consent improves. Hydropower remains flat at roughly 50 GW because new dam sites face environmental limits. Collectively, shifting shares underscore how investment is tilting toward zero-carbon capacity within the Japan power market.
The Japan Power Market Report is Segmented by Power Source (Thermal, Nuclear, and Renewables) and End-User (Utilities, Commercial and Industrial, and Residential). The Market Sizes and Forecasts are Provided in Terms of Installed Capacity (GW).
List of Companies Covered in this Report:
- Tokyo Electric Power Company Holdings (TEPCO)
- Kansai Electric Power Company
- Chubu Electric Power
- Hokkaido Electric Power
- Tohoku Electric Power
- Hokuriku Electric Power
- Chugoku Electric Power
- Shikoku Electric Power
- Kyushu Electric Power
- Okinawa Electric Power
- JERA Co., Inc.
- Electric Power Development Co. (J-POWER)
- Japan Renewable Energy Corporation
- Hitachi Energy
- Mitsubishi Electric Corporation
- Toshiba Energy Systems & Solutions
- Sumitomo Corporation (Renewables)
- Marubeni Corporation (Power)
- Mitsubishi Heavy Industries (Energy)
- Orsted Japan K.K.
Additional Benefits:
- The market estimate (ME) sheet in Excel format
- 3 months of analyst support
TABLE OF CONTENTS
1 Introduction
- 1.1 Study Assumptions & Market Definition
- 1.2 Scope of the Study
2 Research Methodology
3 Executive Summary
4 Market Landscape
- 4.1 Market Overview
- 4.2 Market Drivers
- 4.2.1 Declining PV Module & Installation Costs
- 4.2.2 Offshore Wind Auction Pipeline Expansion
- 4.2.3 Nuclear Reactor Restarts Under GX Policy
- 4.2.4 Grid-Scale Battery Storage Cost Declines
- 4.2.5 Corporate PPA Demand from Heavy Industry
- 4.2.6 Smart-Meter Roll-Out & Demand-Response Upside
- 4.3 Market Restraints
- 4.3.1 LNG Price Volatility & Import Reliance
- 4.3.2 Limited On-Shore Land for Utility Solar
- 4.3.3 Ageing Transmission Assets & Permitting Delays
- 4.3.4 Local Opposition to New High-Voltage Lines
- 4.4 Supply-Chain Analysis
- 4.5 Regulatory Landscape
- 4.6 Technological Outlook
- 4.7 Porter's Five Forces
- 4.7.1 Threat of New Entrants
- 4.7.2 Bargaining Power of Suppliers
- 4.7.3 Bargaining Power of Buyers
- 4.7.4 Threat of Substitutes
- 4.7.5 Competitive Rivalry
- 4.8 PESTLE Analysis
5 Market Size & Growth Forecasts
- 5.1 By Power Source
- 5.1.1 Thermal (Coal, Natural Gas, Oil and Diesel)
- 5.1.2 Nuclear
- 5.1.3 Renewables (Solar, Wind, Hydro, Geothermal, Biomass & Waste, Tidal)
- 5.2 By End User
- 5.2.1 Utilities
- 5.2.2 Commercial and Industrial
- 5.2.3 Residential
- 5.3 By T&D Voltage Level (Qualitative Analysis only)
- 5.3.1 High-Voltage Transmission (Above 230 kV)
- 5.3.2 Sub-Transmission (69 to 161 kV)
- 5.3.3 Medium-Voltage Distribution (13.2 to 34.5 kV)
- 5.3.4 Low-Voltage Distribution (Up to 1 kV)
6 Competitive Landscape
- 6.1 Market Concentration
- 6.2 Strategic Moves (M&A, Partnerships, PPAs)
- 6.3 Market Share Analysis (Market Rank/Share for key companies)
- 6.4 Company Profiles (includes Global level Overview, Market level overview, Core Segments, Financials as available, Strategic Information, Products & Services, and Recent Developments)
- 6.4.1 Tokyo Electric Power Company Holdings (TEPCO)
- 6.4.2 Kansai Electric Power Company
- 6.4.3 Chubu Electric Power
- 6.4.4 Hokkaido Electric Power
- 6.4.5 Tohoku Electric Power
- 6.4.6 Hokuriku Electric Power
- 6.4.7 Chugoku Electric Power
- 6.4.8 Shikoku Electric Power
- 6.4.9 Kyushu Electric Power
- 6.4.10 Okinawa Electric Power
- 6.4.11 JERA Co., Inc.
- 6.4.12 Electric Power Development Co. (J-POWER)
- 6.4.13 Japan Renewable Energy Corporation
- 6.4.14 Hitachi Energy
- 6.4.15 Mitsubishi Electric Corporation
- 6.4.16 Toshiba Energy Systems & Solutions
- 6.4.17 Sumitomo Corporation (Renewables)
- 6.4.18 Marubeni Corporation (Power)
- 6.4.19 Mitsubishi Heavy Industries (Energy)
- 6.4.20 Orsted Japan K.K.
7 Market Opportunities & Future Outlook
- 7.1 White-Space & Unmet-Need Assessment
- 7.2 Progress in Japan's Offshore Wind Power Sector
- 7.3 Grid Digitalisation & Advanced Analytics
- 7.4 Hydrogen/Ammonia Co-Firing in Thermal Plants

