
PUBLISHER: Mordor Intelligence | PRODUCT CODE: 1934582

PUBLISHER: Mordor Intelligence | PRODUCT CODE: 1934582
China Renewable Energy - Market Share Analysis, Industry Trends & Statistics, Growth Forecasts (2026 - 2031)
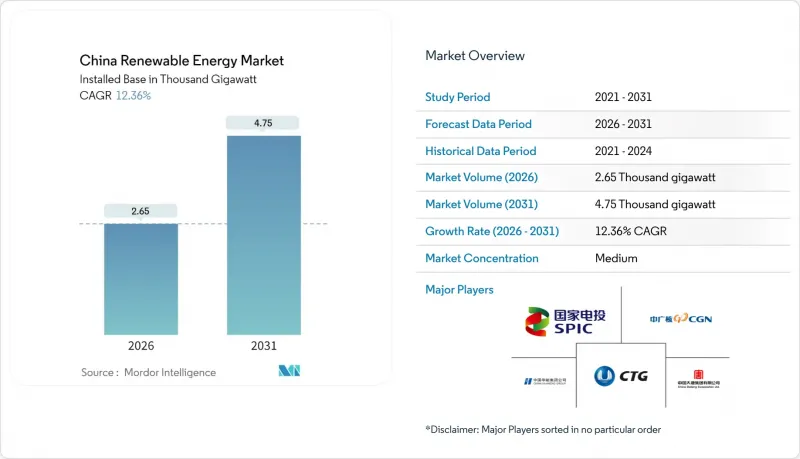
China Renewable Energy Market size in 2026 is estimated at 2.65 Thousand gigawatt, growing from 2025 value of 2.36 Thousand gigawatt with 2031 projections showing 4.75 Thousand gigawatt, growing at 12.36% CAGR over 2026-2031.
Beijing accelerates clean energy deployment in pursuit of its 2060 carbon neutrality pledge. Policy reforms embedded in the 2025 Energy Law, rapid declines in the levelized cost of solar and wind, and the expansion of corporate power-purchase agreements (PPAs) combine to fuel sustained capacity additions, while state utilities upgrade their ultra-high-voltage grids to absorb the rising renewable output. Robust manufacturing ecosystems keep equipment prices low, and provincial renewable-quota penalties further stimulate demand among commercial and industrial buyers. Simultaneously, transmission investments of USD 89 billion and new market-based pricing rules are reshaping revenue models, compelling generators to optimize costs and enhance their competitiveness.
China Renewable Energy Market Trends and Insights
Government 2060 Carbon-Neutrality Mandate & Policy Incentives
Central government decarbonization pledges translate into legally binding capacity quotas that provincial leaders must meet to secure fiscal transfers. The Fourteenth Five-Year Plan orders 1,200 GW of combined wind and solar by 2030, double the 2024 baseline. Provinces falling short lose budget support, so utilities accelerate renewable procurement to protect balance sheets. A parallel green-certificate market lets generators sell environmental attributes in addition to electricity, lifting project returns by up to 200 basis points. Mandatory ISO 14064 reporting further pushes industrial emitters toward renewable sourcing within carbon-trading pilots in Guangdong and Shanghai. The cumulative effect secures long-run visibility for the Chinese renewable energy market.
Rapid LCOE Decline for Solar PV & On-Shore Wind
Utility-scale solar power now delivers energy below USD 0.02 per kWh, 30%-40% cheaper than new coal in high-irradiance provinces. Polysilicon oversupply pushed spot prices to CNY 40 per kg in 2024, allowing module makers to offer sub-USD 0.10 per-watt panels. Wind energy costs have fallen to USD 0.03 per kWh as 6 MW to 8 MW turbines reduce balance-of-plant expenses. Several provincial auctions cleared at CNY 0.28 per kWh, forcing thermal units into peaking roles and freeing grid capacity for renewables. The price edge cements long-term growth in the Chinese renewable energy market.
Grid Curtailment & Transmission Bottlenecks
Curtailment in several western provinces exceeds 10% during peak output despite ongoing construction of ultra-high-voltage lines slated for completion after 2027. The Northwest grid exported 100 billion kWh of clean power in 2024, only 60% of its renewable generation, highlighting stranded capacity. Storage additions topped 70 GW by end-2024 but still trail the flexibility required for rapid variable-renewable growth. Market-based dispatch could intensify short-term curtailment as projects compete for limited transmission capacity, tempering expansion in certain parts of the Chinese renewable energy market.
Other drivers and restraints analyzed in the detailed report include:
- Boom in Hybrid Renewable-Storage Project Approvals
- Provincial Renewable-Quota Penalties Driving Captive Corporate PPAs
- Raw-Material Supply-Chain Volatility
For complete list of drivers and restraints, kindly check the Table Of Contents.
Segment Analysis
The solar segment stood at 46.20% of total capacity in 2025, anchoring the current Chinese renewable energy market size and underscoring the decade-long cost decline that produced sub-USD 0.10-per-watt modules. Auction results at CNY 0.28 per kWh compress margins, so manufacturers seek export demand and vertical integration to sustain returns. Wind contributed about 35% of installed capacity, with offshore additions of 3.39 GW in the first half of 2024, validating deep-water turbine designs that expand resource areas. Hydropower, including pumped storage, provides essential flexibility, and 50 GW of new pumped-storage projects are scheduled by 2025.
Ocean energy started from a negligible base but is projected to post an 77.17% CAGR to 2031, the highest within the Chinese renewable energy market. Zhejiang and Fujian pilots using 1 MW to 5 MW tidal turbines deliver capacity factors above 40%, and RMB 2 billion in central subsidies targets cost cuts toward USD 0.08 per kWh by 2028. Equipment makers adapt offshore-wind supply chains to tidal applications, accelerating commercialization and diversifying the Chinese renewable energy market away from land-based assets.
The China Renewable Energy Market Report is Segmented by Technology (Solar Energy, Wind Energy, Hydropower, Bioenergy, Geothermal, and Ocean Energy) and End-User (Utilities, Commercial and Industrial, and Residential). The Market Sizes and Forecasts are Provided in Terms of Installed Capacity (GW).
List of Companies Covered in this Report:
- China Three Gorges Corporation
- State Power Investment Corporation (SPIC)
- China Huaneng Group
- China Huadian Corporation
- China Datang Corporation Renewable Power
- China General Nuclear (CGN) New Energy
- Sinohydro Corporation
- China Yangtze Power Co. Ltd
- Xinjiang Goldwind Science & Technology Co. Ltd
- Dongfang Electric Corporation Ltd
- Ming Yang Smart Energy
- Envision Energy
- Sinovel Wind Group Co. Ltd
- JinkoSolar Holdings Co. Ltd
- Trina Solar Co. Ltd
- LONGi Green Energy Technology Co. Ltd
- JA Solar Technology Co. Ltd
- Canadian Solar Inc. (China ops)
- Sungrow Power Supply Co. Ltd
- TBEA Co. Ltd
Additional Benefits:
- The market estimate (ME) sheet in Excel format
- 3 months of analyst support
TABLE OF CONTENTS
1 Introduction
- 1.1 Study Assumptions & Market Definition
- 1.2 Scope of the Study
2 Research Methodology
3 Executive Summary
4 Market Landscape
- 4.1 Market Overview
- 4.2 Market Drivers
- 4.2.1 Government 2060 carbon-neutrality mandate & policy incentives
- 4.2.2 Rapid LCOE decline for solar PV & on-shore wind
- 4.2.3 Grid-parity policies & green-power trading liberalisation
- 4.2.4 Provincial renewable-quota penalties driving captive corporate PPAs
- 4.2.5 Boom in hybrid renewable-storage project approvals
- 4.2.6 Mandatory rooftop PV on new public buildings
- 4.3 Market Restraints
- 4.3.1 Grid curtailment & transmission bottlenecks
- 4.3.2 Raw-material supply-chain volatility (polysilicon, rare-earths)
- 4.3.3 Land-use conflicts causing stricter project permitting
- 4.3.4 Feed-in-tariff phase-out & low auction prices
- 4.4 Supply-Chain Analysis
- 4.5 Regulatory Landscape
- 4.6 Technological Outlook
- 4.7 Porter's Five Forces
- 4.7.1 Threat of New Entrants
- 4.7.2 Bargaining Power of Suppliers
- 4.7.3 Bargaining Power of Buyers
- 4.7.4 Threat of Substitutes
- 4.7.5 Industry Rivalry
- 4.8 PESTLE Analysis
5 Market Size & Growth Forecasts
- 5.1 By Technology
- 5.1.1 Solar Energy (PV and CSP)
- 5.1.2 Wind Energy (Onshore and Offshore)
- 5.1.3 Hydropower (Small, Large, PSH)
- 5.1.4 Bioenergy
- 5.1.5 Geothermal
- 5.1.6 Ocean Energy (Tidal and Wave)
- 5.2 By End-User
- 5.2.1 Utilities
- 5.2.2 Commercial and Industrial
- 5.2.3 Residential
6 Competitive Landscape
- 6.1 Market Concentration
- 6.2 Strategic Moves (M&A, Partnerships, PPAs)
- 6.3 Market Share Analysis (Market Rank/Share for key companies)
- 6.4 Company Profiles (includes Global level Overview, Market level overview, Core Segments, Financials as available, Strategic Information, Products & Services, and Recent Developments)
- 6.4.1 China Three Gorges Corporation
- 6.4.2 State Power Investment Corporation (SPIC)
- 6.4.3 China Huaneng Group
- 6.4.4 China Huadian Corporation
- 6.4.5 China Datang Corporation Renewable Power
- 6.4.6 China General Nuclear (CGN) New Energy
- 6.4.7 Sinohydro Corporation
- 6.4.8 China Yangtze Power Co. Ltd
- 6.4.9 Xinjiang Goldwind Science & Technology Co. Ltd
- 6.4.10 Dongfang Electric Corporation Ltd
- 6.4.11 Ming Yang Smart Energy
- 6.4.12 Envision Energy
- 6.4.13 Sinovel Wind Group Co. Ltd
- 6.4.14 JinkoSolar Holdings Co. Ltd
- 6.4.15 Trina Solar Co. Ltd
- 6.4.16 LONGi Green Energy Technology Co. Ltd
- 6.4.17 JA Solar Technology Co. Ltd
- 6.4.18 Canadian Solar Inc. (China ops)
- 6.4.19 Sungrow Power Supply Co. Ltd
- 6.4.20 TBEA Co. Ltd
7 Market Opportunities & Future Outlook
- 7.1 White-space & unmet-need assessment

