
PUBLISHER: Mordor Intelligence | PRODUCT CODE: 1934695

PUBLISHER: Mordor Intelligence | PRODUCT CODE: 1934695
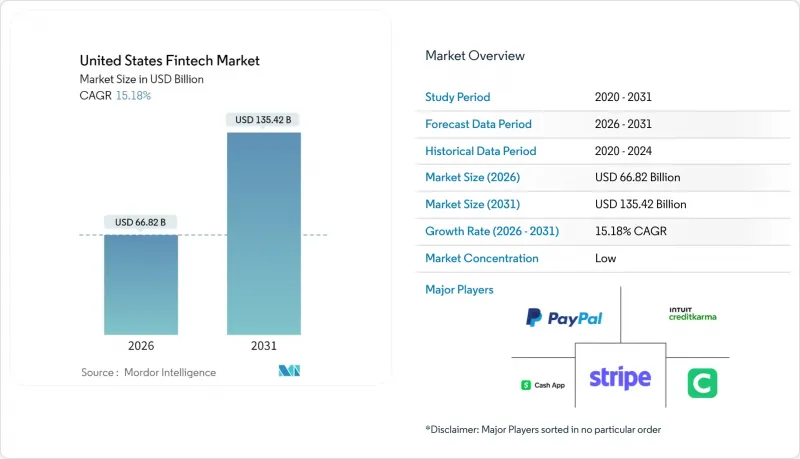
United States Fintech - Market Share Analysis, Industry Trends & Statistics, Growth Forecasts (2026 - 2031)
The United States fintech market size in 2026 is estimated at USD 66.82 billion, growing from 2025 value of USD 58.01 billion with 2031 projections showing USD 135.42 billion, growing at 15.18% CAGR over 2026-2031.
A combination of nationwide real-time payment infrastructure, embedded finance adoption, and artificial-intelligence-driven risk tools is reshaping customer expectations and forcing incumbents to modernize. Venture capital investment has begun to recover from the 2024 trough, yet regulatory scrutiny of bank-fintech partnerships remains intense, influencing how quickly new products reach the market. Regionally, the United States fintech market continues to benefit from the West's technology ecosystem, even as the South records the fastest growth due to lower operating costs and supportive state policies. Competitive intensity is moderate because no single firm exceeds a double-digit share, leaving space for vertical specialists and community-bank-backed platforms to thrive.
United States Fintech Market Trends and Insights
Real-Time Payments Rollout Accelerates Digital Adoption
FedNow expanded from 35 launch banks to more than 1,300 institutions by August 2024, illustrating how public infrastructure can overcome network-effect barriers. The USD 500,000 transaction ceiling attracts commercial flows that once relied on wires. Concurrently, The Clearing House's RTP network processed 87 million transfers worth USD 69 billion in Q3 2024, growing about 17% quarter-over-quarter. Fintech providers leverage these rails to offer instant bill pay and earned-wage access, boosting daily active users. Yet the proliferation of multiple instant-payment schemes raises interoperability challenges that favor orchestration platforms able to abstract settlement complexity for community banks.
Embedded Finance Uptake by Vertical SaaS Platforms
Vertical software vendors now generate three-to-four times more revenue once payments and lending become embedded features, shifting their strategic focus from licensing fees to transaction economics. Banking-as-a-Service (BaaS) intermediaries fill regulatory gaps, though new OCC and FDIC guidance issued in July 2024 elevates due-diligence costs for sponsor banks. Established core-banking providers such as Temenos took minority stakes in U.S. BaaS players to accelerate time-to-market instead of rebuilding tech stacks from scratch. Interchange caps under the Durbin Amendment incentivize smaller community banks to partner with SaaS platforms, fragmenting issuer relationships but broadening service reach. ISO 20022 data standards further enhance reconciliation and dynamic pricing modules embedded within these vertical ecosystems.
Fragmented Federal & State Regulation Raises Compliance Burden
Fintech firms must navigate 50 state money-transmitter regimes plus overlapping federal oversight, which increases legal costs and lengthens product launches. The July 2024 OCC-FDIC guidance imposed stronger vendor-management rules on BaaS banks, prompting several fintech sponsors to pause onboarding while they upgrade controls. Early-stage startups may spend 20% of operating budgets on AML/KYC requirements, limiting experimentation and favoring well-capitalized incumbents. Potential CFPB action on liability sharing for scam losses adds another layer of uncertainty. Collectively, these factors moderate the near-term expansion pace of the United States fintech market.
Other drivers and restraints analyzed in the detailed report include:
- Mobile Wallet & Contactless Penetration Across Demographics
- AI/ML-Driven Credit & Fraud Models Improve Risk Economics
- Escalating Fraud & Cybersecurity Costs in Real-Time Rails
For complete list of drivers and restraints, kindly check the Table Of Contents.
Segment Analysis
Digital Payments controlled 46.78% of the United States fintech market in 2025, reflecting broad consumer and merchant acceptance across cards, wallets, and account-to-account rails. Neobanking, while smaller, is projected to grow at a 21.05% CAGR through 2031, underpinned by branch-free models that reduce cost-to-serve and enable fee-free checking propositions. The United States fintech market size for Neobanking is therefore expected to widen considerably, attracting investors despite tighter capital markets.
Cross-selling is increasing: payment-facilitating SaaS vendors now embed short-term lending and treasury tools, weaving multiple propositions into a single workflow. Digital Lending & Financing maintains a healthy 26.92% share, aided by AI underwriting that speeds decisions for thin-file borrowers. Insurtech accounts for only 7.36% because of capital adequacy rules, yet its usage-based auto and embedded travel policies illustrate convergence with payment channels. Digital Investments, at 4.89%, is consolidating after Goldman Sachs exited pure robo-advice; incumbents leverage omnichannel distribution to hold assets. These overlaps illustrate how every proposition ultimately competes for wallet share within the United States fintech market.
The United States Fintech Market Report is Segmented by Service Proposition (Digital Payments, Digital Lending & Financing, Digital Investments, Insurtech, Neobanking), End-User (Retail, Businesses), User Interface (Mobile Applications, Web/Browser, POS/IoT Devices), and Geography (Northeast, Midwest, South, West). The Market Forecasts are Provided in Terms of Value (USD).
List of Companies Covered in this Report:
- PayPal
- Stripe
- Block (Square & Cash App)
- Intuit (QuickBooks / Credit Karma)
- Chime
- SoFi
- Affirm
- Coinbase
- Robinhood
- Fiserv
- FIS
- Plaid
- Adyen
- Wise
- Klarna
- Varo Bank
- Upgrade
- Marqeta
- Navy Federal Credit Union (digital lending)
- Green Dot
Additional Benefits:
- The market estimate (ME) sheet in Excel format
- 3 months of analyst support
TABLE OF CONTENTS
1 Introduction
- 1.1 Study Assumptions & Market Definition
- 1.2 Scope of the Study
2 Research Methodology
3 Executive Summary
4 Market Landscape
- 4.1 Market Overview
- 4.2 Market Drivers
- 4.2.1 Real-time payments (FedNow, RTP) rollout accelerates digital adoption
- 4.2.2 Embedded finance uptake by vertical SaaS platforms
- 4.2.3 Mobile wallet & contactless penetration across demographics
- 4.2.4 AI/ML-driven credit & fraud models improve risk economics
- 4.2.5 "Fin-infra-as-code" open-source stacks slash go-to-market time
- 4.2.6 Tokenised deposits & programmable money pilots by U.S. megabanks
- 4.3 Market Restraints
- 4.3.1 Fragmented federal & state regulation raises compliance burden
- 4.3.2 Escalating fraud & cybersecurity costs in real-time rails
- 4.3.3 Funding pull-back & valuation compression post-2022
- 4.3.4 Heightened OCC/FDIC scrutiny of sponsor-bank partnerships
- 4.4 Value / Supply-Chain Analysis
- 4.5 Regulatory Landscape
- 4.6 Technological Outlook
- 4.7 Porter's Five Forces
- 4.7.1 Threat of New Entrants
- 4.7.2 Bargaining Power of Suppliers
- 4.7.3 Bargaining Power of Buyers
- 4.7.4 Threat of Substitutes
- 4.7.5 Competitive Rivalry
5 Market Size & Growth Forecasts
- 5.1 By Service Proposition
- 5.1.1 Digital Payments
- 5.1.2 Digital Lending & Financing
- 5.1.3 Digital Investments
- 5.1.4 Insurtech
- 5.1.5 Neobanking
- 5.2 By End-User
- 5.2.1 Retail
- 5.2.2 Businesses
- 5.3 By User Interface
- 5.3.1 Mobile Applications
- 5.3.2 Web / Browser
- 5.3.3 POS / IoT Devices
- 5.4 By Geography
- 5.4.1 Northeast
- 5.4.2 Midwest
- 5.4.3 South
- 5.4.4 West
6 Competitive Landscape
- 6.1 Market Concentration
- 6.2 Strategic Moves
- 6.3 Market Share Analysis
- 6.4 Company Profiles (includes Global level Overview, Market level overview, Core Segments, Financials as available, Strategic Information, Market Rank/Share, Products & Services, Recent Developments)
- 6.4.1 PayPal
- 6.4.2 Stripe
- 6.4.3 Block (Square & Cash App)
- 6.4.4 Intuit (QuickBooks / Credit Karma)
- 6.4.5 Chime
- 6.4.6 SoFi
- 6.4.7 Affirm
- 6.4.8 Coinbase
- 6.4.9 Robinhood
- 6.4.10 Fiserv
- 6.4.11 FIS
- 6.4.12 Plaid
- 6.4.13 Adyen
- 6.4.14 Wise
- 6.4.15 Klarna
- 6.4.16 Varo Bank
- 6.4.17 Upgrade
- 6.4.18 Marqeta
- 6.4.19 Navy Federal Credit Union (digital lending)
- 6.4.20 Green Dot
7 Market Opportunities & Future Outlook
- 7.1 SME real-time treasury & payables orchestration platforms
- 7.2 Shared synthetic-identity sandbox for secure bank-fintech data exchange

