
PUBLISHER: Mordor Intelligence | PRODUCT CODE: 1934699

PUBLISHER: Mordor Intelligence | PRODUCT CODE: 1934699
United States Cross Border Road Freight Transport - Market Share Analysis, Industry Trends & Statistics, Growth Forecasts (2026 - 2031)
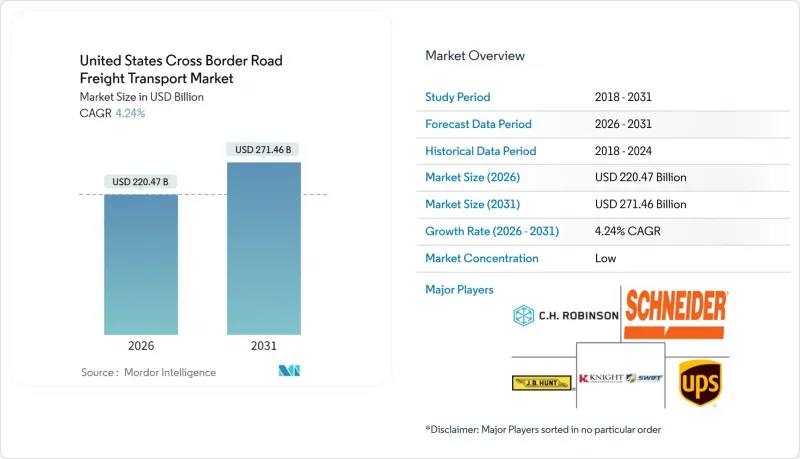
The United States cross border road freight transport market is expected to grow from USD 211.51 billion in 2025 to USD 220.47 billion in 2026 and is forecast to reach USD 271.46 billion by 2031 at 4.24% CAGR over 2026-2031.
Nearshoring within the USMCA trade corridor, sustained e-commerce expansion, and large-scale infrastructure upgrades are reinforcing demand even as tighter security protocols and labor shortages test network agility. Mexico has overtaken China as the United States' largest trading partner, creating dense south-north truck lanes that now channel more than USD 3 billion in daily commerce, while Canada retains a vital but costlier role due to carbon-pricing regimes. Persistent driver scarcity, widening to a projected 160,000-person deficit by 2032, is pushing rates higher and accelerating technology adoption that boosts equipment utilization and pricing precision. Consolidation among top carriers, exemplified by DSV's purchase of DB Schenker and Ryder's acquisition push, is enabling scale efficiencies in cross-border dedicated fleets even as niche operators gain share in temperature-controlled and e-commerce-led LTL lanes. Autonomous truck pilots on the Interstate 45 and Interstate 35 corridors and AI-enabled pricing engines are lowering empty miles and rounding out 24/7 long-haul capacity, placing technology at the heart of competitive advantage.
United States Cross Border Road Freight Transport Market Trends and Insights
USMCA and Near-Shoring Fueling a Mexico-U.S. Freight Surge
USMCA provisions have catalyzed a USD 1.3 trillion trade corridor that funnels manufacturing exports from Mexico to the United States and has already drawn USD 46 billion in new investment commitments through 2027. Monthly truck crossings average 1.5 million units, a 166.3% jump versus pre-pandemic flows, overwhelming legacy border infrastructure and lifting carrier pricing power as northbound industrial freight pushes capacity limits. Demand for industrial space along the Mexican side has doubled since 2019, confirming manufacturers' preference for proximity over distant Asian supply chains. Automotive OEMs illustrate the multiplier effect: every USD 1 billion poured into Mexican assembly plants triggers sizable localized logistics demand that migrates north, reinforcing the growth arc of the United States cross border road freight transport market.
Reshoring Sparking Stronger Northbound Auto-Parts Traffic from Mexico
Automotive supply chains continue to retool as Asian component makers site new Mexican factories to preserve U.S. market access amid trade frictions, exemplified by a USD 400 million investment by Shanghai Unison in 2024. These additions skew lane balance, with northbound trailers commanding premium spot rates while southbound rates stagnate, complicating asset repositioning and elevating carrier margins on preferred directions. Semiconductor and battery firms mirror this footprint, further amplifying northbound tonnage. Real-time visibility platforms are now indispensable for cargo-theft mitigation and for orchestrating inbound origin docks with U.S. destination plants, sustaining the efficiency of the United States cross border road freight transport market.
Driver Shortages Driving Up Line-Haul Rates
The labor crunch could double to 160,000 vacant seats by 2032 as the cohort aged over 55 exits in greater numbers than new entrants replace them, pushing line-haul rates higher and eroding small-carrier resilience. FMCSA grants worth USD 48 million are widening CDL training pathways, yet cross-border work demands additional security clearances that limit candidate pools. Exemptions allowing learner-permit holders to operate in revenue service signal how urgently fleets must shore up capacity, and this constraint is the largest structural drag on the United States cross border road freight transport market.
Other drivers and restraints analyzed in the detailed report include:
- E-Commerce Growth Boosting Demand for Time-Definite Cross-Border LTL
- Expanded CTPAT FAST Lanes Reducing Border Delays
- Canadian Carbon Pricing Adding Hidden Costs for U.S. Carriers
For complete list of drivers and restraints, kindly check the Table Of Contents.
Segment Analysis
Manufacturing generated 32.14% of the United States cross border road freight transport market share in 2025, anchored by complex automotive and industrial supply chains that require dedicated FTL capacity and stringent just-in-time reliability. The United States cross border road freight transport market size tied to manufacturing lanes is projected to expand steadily as OEMs and tier suppliers deepen near-shoring investments, although incremental gains moderate due to commodity price swings affecting metals and plastics. Wholesale and retail trade volumes have begun to rise faster as cross-border e-commerce penetration propels shipment counts; the segment is forecast to log a 4.92% CAGR (2026-2031) as consumer-facing firms press for more frequent, smaller-lot deliveries.
Diversification across electronics, healthcare equipment, and agricultural perishables enriches the shipment mix, calling for wider equipment varieties and bolstering LTL and temperature-controlled sub-markets. Wholesale and retail trade players embrace blockchain-enabled customs filing to compress clearance windows, while auto makers expand digital twin modeling for lane optimization. Together, these shifts reinforce manufacturing's anchor role yet spotlight retail's growing pull on carrier network design across the United States cross border road freight transport market.
Non-containerized freight held 85.05% of the United States cross border road freight transport market share in 2025, powered by bulk commodities and oversized auto components that depend on direct truck service. Time-sensitive manufacturing cargo sidesteps rail handoffs, cementing trucking's modal advantage despite rising rail competitiveness.
Containerized freight is poised for a 4.82% CAGR (2026-2031) as intermodal services integrate blockchain-supported tracking that slashes document errors and enhances visibility. E-tailers importing fast-moving goods in 40-ft boxes are experimenting with truck-rail transloads along the U.S.-Mexico Gulf corridor, tempering highway lane congestion. Non-containerized dominance will hold through 2030, yet incremental intermodal penetration signals carriers must broaden asset portfolios to capture rising container drayage revenue within the United States cross border road freight transport market.
The United States Cross Border Road Freight Transport Market Report is Segmented by End User Industry (Construction and More), Truckload Specification (Full-Truck-Load (FTL) and More), Containerization (Containerized and More), Distance (Long Haul and Short Haul), Goods Configuration (Fluid Goods and Solid Goods), and Temperature Control (Temperature Controlled and More). The Market Forecasts are Provided in Terms of Value (USD).
List of Companies Covered in this Report:
- ArcBest Corporation
- ATS (Anderson Trucking Service)
- Bay and Bay Transportation
- C.H. Robinson Worldwide, Inc.
- C.R. England
- Covenant Logistics Group, Inc.
- CRST The Transportation Solution, Inc.
- DHL Group
- DSV A/S (Including DB Schenker)
- Estes Express Lines
- FedEx
- J.B. Hunt Transport, Inc.
- Knight-Swift Transportation Holdings, Inc. (Including Swift Transportation Company)
- Landstar System, Inc.
- Old Dominion Freight Line
- Penske Corporation, Inc.
- R+L Carriers
- Ryder System, Inc.
- Schneider National, Inc.
- United Parcel Service of America, Inc. (UPS)
- Werner Enterprises, Inc.
- XPO, Inc.
Additional Benefits:
- The market estimate (ME) sheet in Excel format
- 3 months of analyst support
TABLE OF CONTENTS
1 Introduction
- 1.1 Study Assumptions and Market Definition
- 1.2 Scope of the Study
2 Research Methodology
3 Executive Summary
4 Market Landscape
- 4.1 Market Overview
- 4.2 Demographics
- 4.3 GDP Distribution by Economic Activity
- 4.4 GDP Growth by Economic Activity
- 4.5 Economic Performance and Profile
- 4.5.1 Trends in E-Commerce Industry
- 4.5.2 Trends in Manufacturing Industry
- 4.6 Transport and Storage Sector GDP
- 4.7 Logistics Performance
- 4.8 Length of Roads
- 4.9 Export Trends
- 4.10 Import Trends
- 4.11 Fuel Pricing Trends
- 4.12 Trucking Operational Costs
- 4.13 Road Freight Tonnage Trends
- 4.14 Road Freight Pricing Trends
- 4.15 Modal Share
- 4.16 Inflation
- 4.17 Regulatory Framework
- 4.18 Value Chain and Distribution Channel Analysis
- 4.19 Market Drivers
- 4.19.1 USMCA and Near-Shoring Fueling a Mexico-U.S. Freight Surge
- 4.19.2 Reshoring Sparking Stronger Northbound Auto-Parts Traffic From Mexico
- 4.19.3 E-Commerce Growth Boosting Demand for Time-Definite Cross-Border LTL
- 4.19.4 Expanded CTPAT FAST Lanes Reducing Border Delays
- 4.19.5 Autonomous Truck Trials Gaining Traction on I-45 and I-35 Trade Routes
- 4.19.6 AI-Powered Pricing Platforms Quietly Reshaping the Market
- 4.20 Market Restraints
- 4.20.1 Driver Shortages Driving Up Line-Haul Rates
- 4.20.2 Canadian Carbon Pricing Adding Hidden Costs for U.S. Carriers
- 4.20.3 Heightened Border Security Creating Unpredictable Wait Times
- 4.20.4 Wildfire-Related Closures Disrupting U.S.-Canada Highway Routes
- 4.21 Technology Innovations in the Market
- 4.22 Porter's Five Forces Analysis
- 4.22.1 Threat of New Entrants
- 4.22.2 Bargaining Power of Buyers
- 4.22.3 Bargaining Power of Suppliers
- 4.22.4 Threat of Substitutes
- 4.22.5 Competitive Rivalry
5 Market Size and Growth Forecasts (Value, USD)
- 5.1 End User Industry
- 5.1.1 Agriculture, Fishing, and Forestry
- 5.1.2 Construction
- 5.1.3 Manufacturing
- 5.1.4 Oil and Gas, Mining and Quarrying
- 5.1.5 Wholesale and Retail Trade
- 5.1.6 Others
- 5.2 Truckload Specification
- 5.2.1 Full-Truck-Load (FTL)
- 5.2.2 Less than-Truck-Load (LTL)
- 5.3 Containerization
- 5.3.1 Containerized
- 5.3.2 Non-Containerized
- 5.4 Distance
- 5.4.1 Long Haul
- 5.4.2 Short Haul
- 5.5 Goods Configuration
- 5.5.1 Fluid Goods
- 5.5.2 Solid Goods
- 5.6 Temperature Control
- 5.6.1 Non-Temperature Controlled
- 5.6.2 Temperature Controlled
6 Competitive Landscape
- 6.1 Market Concentration
- 6.2 Key Strategic Moves
- 6.3 Market Share Analysis
- 6.4 Company Profiles (Includes Global Level Overview, Market Level Overview, Core Segments, Financials as Available, Strategic Information, Market Rank/Share for Key Companies, Products and Services, and Recent Developments)
- 6.4.1 ArcBest Corporation
- 6.4.2 ATS (Anderson Trucking Service)
- 6.4.3 Bay and Bay Transportation
- 6.4.4 C.H. Robinson Worldwide, Inc.
- 6.4.5 C.R. England
- 6.4.6 Covenant Logistics Group, Inc.
- 6.4.7 CRST The Transportation Solution, Inc.
- 6.4.8 DHL Group
- 6.4.9 DSV A/S (Including DB Schenker)
- 6.4.10 Estes Express Lines
- 6.4.11 FedEx
- 6.4.12 J.B. Hunt Transport, Inc.
- 6.4.13 Knight-Swift Transportation Holdings, Inc. (Including Swift Transportation Company)
- 6.4.14 Landstar System, Inc.
- 6.4.15 Old Dominion Freight Line
- 6.4.16 Penske Corporation, Inc.
- 6.4.17 R+L Carriers
- 6.4.18 Ryder System, Inc.
- 6.4.19 Schneider National, Inc.
- 6.4.20 United Parcel Service of America, Inc. (UPS)
- 6.4.21 Werner Enterprises, Inc.
- 6.4.22 XPO, Inc.
7 Market Opportunities and Future Outlook
- 7.1 White-space and Unmet-need Assessment

