
PUBLISHER: Mordor Intelligence | PRODUCT CODE: 1937352

PUBLISHER: Mordor Intelligence | PRODUCT CODE: 1937352
Sea Freight Forwarding - Market Share Analysis, Industry Trends & Statistics, Growth Forecasts (2026 - 2031)
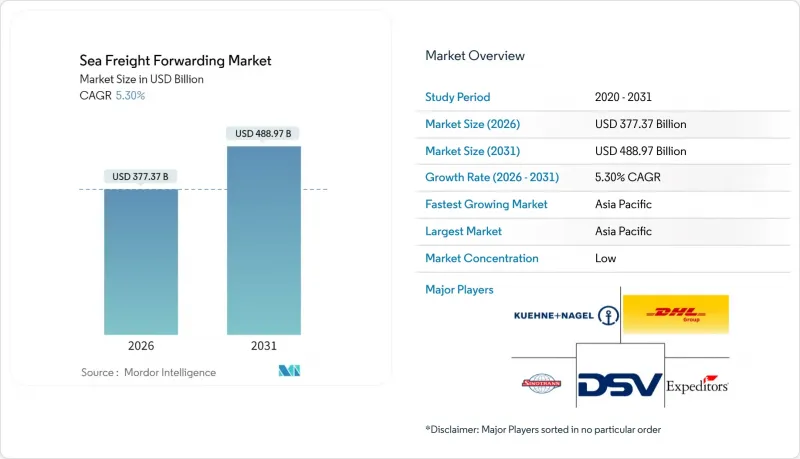
The Sea Freight Forwarding Market was valued at USD 358.31 billion in 2025 and estimated to grow from USD 377.37 billion in 2026 to reach USD 488.97 billion by 2031, at a CAGR of 5.30% during the forecast period (2026-2031).
Robust earnings at container lines, the march toward digital booking standards, and a global pivot from just-in-time to just-in-case inventory strategies underpin this outlook. Merchant-fleet capacity additions, fresh port investments, and e-commerce-linked shipment fragmentation are widening the opportunity set for service providers that can guarantee space, speed, and visibility. Alliances controlling 80% of container capacity have announced new operating structures that take effect in 2025, further tightening schedule coordination and slot utilization. Yet the arrival of 478 new boxships in 2024 outpaced demand, pressuring spot rates and handing shippers negotiating leverage.
Global Sea Freight Forwarding Market Trends and Insights
Surge in container-port capacity additions 2025-2030
China's top eight gateways lifted 224 million TEU in 2024, up 7%, while Shanghai crossed 50 million TEU, cementing its rank as the world's busiest container port. Major U.S. hubs also broke throughput records; the Port of Los Angeles hit 10.3 million units and is investing in zero-emission yard gear. New megaprojects at Nansha, Chancay, and Tuas promise to reset sailing patterns, intensifying competition among freight forwarders for volume commitments. Parallel fleet growth-478 deliveries in 2024 alone hands shippers more slot choice, enabling forwarders to bargain harder for rates.
Rapid scaling of cross-border e-commerce fulfillment networks
Global retail e-commerce sales are tracking toward USD 8 trillion by 2027, producing a wave of parcel-sized ocean consignments. Walmart's "port-to-door" service has already cleared 1,988 TEU for marketplace sellers, exemplifying how major retailers are internalizing logistics. Forwarders embracing application-program-interface connectivity can batch disparate seller orders into cohesive Less-than-Container-Load solutions, trimming dwell time and customs friction.
Freight-rate volatility linked to IMO 2023 fuel-sulfur cap surcharges
Very-Low-Sulfur Fuel Oil averaged USD 608 per ton in 2024; ETS levies will add USD 170-210 per ton for voyages touching European waters from 2025. Bunker Adjustment Factors jumped to USD 623 per FEU on Asia-USWC contracts, consuming 37% of all-in rates. Forwarders must hedge or pass through surcharges, a delicate balancing act in competitive bid cycles.
Other drivers and restraints analyzed in the detailed report include:
- Widespread carrier digital booking platforms and API connectivity
- Growing near-shoring of battery-grade raw materials
- Ocean-carrier vertical integration squeezing independent forwarder margins
For complete list of drivers and restraints, kindly check the Table Of Contents.
Segment Analysis
Full-Container-Load shipments secured 60.35% of the sea freight forwarding market in 2025, upholding their status as the workhorse for manufacturers that frontloaded inventory during pandemic bottlenecks. The sea freight forwarding market size for FCL is forecast to climb alongside port-capacity projects and alliance network revamps. Conversely, Less-than-Container-Load, though smaller, benefits from a 4.63% CAGR as e-commerce sellers lean on LCL consolidations to maintain SKU availability. The sea freight forwarding market share of LCL will inch higher as API-linked booking platforms simplify cargo co-loading and customs pre-clearance steps.
Digital quoting tools now surface optimal FCL vs. LCL decisions in seconds, nudging mid-volume shippers toward the most cost-efficient mode per sailing. Consolidators that guarantee 48-hour container stuffing windows and electronic House Bills are attracting B2C platforms that ship direct to consumer. As volatility lingers in spot indexes, FCL contract mechanisms featuring bunker float clauses and carbon-intensity adjustments will shape rate ceilings for 2025 tenders, reinforcing the pricing sophistication gap between scale players and smaller brokers.
The Sea Freight Forwarding Market Report is Segmented by Service Type (Full-Container-Load, Less-Than-Container-Load), Cargo Type (Dry, Reefer), End-User Industry (Electronics & Semiconductors, Chemicals & Petrochemicals, Food & Beverage, Pharmaceuticals & Healthcare, and More), and Geography (North America, South America, Asia-Pacific, Europe, Middle East and Africa). The Market Forecasts are Provided in Terms of Value (USD).
Geography Analysis
Asia-Pacific generated 40.55% of 2025 revenue and posts a regional 5.02% CAGR to 2031, buoyed by Chinese exports, Southeast-Asian near-sourcing, and intense intra-Asian trade. Shanghai's record 50 million TEU milestone and South-China's Nansha expansion give forwarders abundant sailings to fill.
North America saw combined import volumes at its top ports jump 13% to 28.2 million TEU in 2024, aided by restocking in consumer durables AJOT. The sea freight forwarding market size tied to U.S.-Mexico near-shoring corridors is swelling, especially for automotive, electronics, and battery supply chains.
Europe wrestles with Suez detours that add 10-14 days to Asia rotations; traffic is still 57% below peak despite toll breaks. Carbon-footprint auditing, mandated by the EU-ETS and FuelEU Maritime rules, emerges as a service differentiator.
Middle East & Africa benefits from giga-projects across the Gulf and Horn of Africa corridor upgrades. Breakbulk and project forwarders anticipate wind-turbine and refinery modules to dominate outbound charters.
South America leverages its neutrality to court diversification trade; Panama Canal set a 1,200-transit record in the January-May 2025 window, cementing its gateway role.
- Kuehne + Nagel
- DHL Global Forwarding
- Sinotrans
- DSV A/S
- Expeditors International
- C.H. Robinson Worldwide
- CEVA Logistics
- Kerry Logistics
- Nippon Express
- Hellmann Worldwide Logistics
- Geodis
- Yusen Logistics
- Rhenus Logistics
- UPS Supply Chain Solutions
- Savino Del Bene
- Kintetsu World Express
- LX Pantos
- Ningbo Port Southeast Logistics Group
- Worldwide Logistics Group
- CTS International Logistics
Additional Benefits:
- The market estimate (ME) sheet in Excel format
- 3 months of analyst support
TABLE OF CONTENTS
1 Introduction
- 1.1 Study Assumptions and Market Definition
- 1.2 Scope of the Study
2 Research Methodology
3 Executive Summary
4 Market Landscape
- 4.1 Market Overview
- 4.2 Market Drivers
- 4.2.1 Surge in container-port capacity additions 2025-2030
- 4.2.2 Rapid scaling of cross-border e-commerce fulfilment networks
- 4.2.3 Widespread carrier digital booking platforms and API connectivity
- 4.2.4 Growing near-shoring of battery-grade raw-materials
- 4.2.5 Decarbonisation mandates driving demand for end-to-end CO2-audited logistics
- 4.2.6 Global roll-out of maritime-insurance parametric products lowering cargo risk
- 4.3 Market Restraints
- 4.3.1 Freight-rate volatility linked to IMO 2023 fuel-sulphur cap surcharges
- 4.3.2 Ocean-carrier vertical integration squeezing independent forwarder margins
- 4.3.3 Cyber-security exposure of legacy transport-management systems (TMS)
- 4.3.4 Canal-route geopolitical disruptions (Suez, Panama draught limits)
- 4.4 Value / Supply-Chain Analysis
- 4.5 Regulatory Landscape
- 4.6 Technological Outlook
- 4.7 Geopolitical and Pandemic Impact Review
- 4.8 Freight-Rate and Surcharges Trend Analysis
- 4.9 Porter's Five Forces
- 4.9.1 Bargaining Power of Suppliers
- 4.9.2 Bargaining Power of Buyers
- 4.9.3 Threat of New Entrants
- 4.9.4 Threat of Substitutes
- 4.9.5 Competitive Rivalry
5 Market Size and Growth Forecasts (Value, USD Bn)
- 5.1 By Service Type
- 5.1.1 Full-Container-Load (FCL)
- 5.1.2 Less-than-Container-Load (LCL)
- 5.2 By Cargo Type
- 5.2.1 Dry
- 5.2.2 Reefer
- 5.3 By End-User Industry
- 5.3.1 Electronics and Semiconductors
- 5.3.2 Chemicals and Petrochemicals
- 5.3.3 Food and Beverage
- 5.3.4 Pharmaceuticals and Healthcare
- 5.3.5 Retail and E-commerce
- 5.3.6 Others
- 5.4 By Geography
- 5.4.1 North America
- 5.4.1.1 United States
- 5.4.1.2 Canada
- 5.4.1.3 Mexico
- 5.4.2 South America
- 5.4.2.1 Brazil
- 5.4.2.2 Peru
- 5.4.2.3 Chile
- 5.4.2.4 Argentina
- 5.4.2.5 Rest of South America
- 5.4.3 Asia-Pacific
- 5.4.3.1 India
- 5.4.3.2 China
- 5.4.3.3 Japan
- 5.4.3.4 Australia
- 5.4.3.5 South Korea
- 5.4.3.6 South East Asia (Singapore, Malaysia, Thailand, Indonesia, Vietnam, and Philippines)
- 5.4.3.7 Rest of Asia-Pacific
- 5.4.4 Europe
- 5.4.4.1 United Kingdom
- 5.4.4.2 Germany
- 5.4.4.3 France
- 5.4.4.4 Spain
- 5.4.4.5 Italy
- 5.4.4.6 BENELUX (Belgium, Netherlands, and Luxembourg)
- 5.4.4.7 NORDICS (Denmark, Finland, Iceland, Norway, and Sweden)
- 5.4.4.8 Rest of Europe
- 5.4.5 Middle East and Africa
- 5.4.5.1 United Arab of Emirates
- 5.4.5.2 Saudi Arabia
- 5.4.5.3 South Africa
- 5.4.5.4 Nigeria
- 5.4.5.5 Rest of Middle East And Africa
- 5.4.1 North America
6 Competitive Landscape
- 6.1 Market Concentration
- 6.2 Strategic Moves
- 6.3 Market Share Analysis
- 6.4 Company Profiles (includes Global level Overview, Market level overview, Core Segments, Financials as available, Strategic Information, Market Rank/Share for key companies, Products and Services, and Recent Developments)
- 6.4.1 Kuehne + Nagel
- 6.4.2 DHL Global Forwarding
- 6.4.3 Sinotrans
- 6.4.4 DSV A/S
- 6.4.5 Expeditors International
- 6.4.6 C.H. Robinson Worldwide
- 6.4.7 CEVA Logistics
- 6.4.8 Kerry Logistics
- 6.4.9 Nippon Express
- 6.4.10 Hellmann Worldwide Logistics
- 6.4.11 Geodis
- 6.4.12 Yusen Logistics
- 6.4.13 Rhenus Logistics
- 6.4.14 UPS Supply Chain Solutions
- 6.4.15 Savino Del Bene
- 6.4.16 Kintetsu World Express
- 6.4.17 LX Pantos
- 6.4.18 Ningbo Port Southeast Logistics Group
- 6.4.19 Worldwide Logistics Group
- 6.4.20 CTS International Logistics
7 Market Opportunities and Future Outlook
- 7.1 White-space and Unmet-Need Assessment

