
PUBLISHER: Mordor Intelligence | PRODUCT CODE: 1938992

PUBLISHER: Mordor Intelligence | PRODUCT CODE: 1938992
Biological Organic Fertilizer - Market Share Analysis, Industry Trends & Statistics, Growth Forecasts (2026 - 2031)
Biological organic fertilizer market size in 2026 is estimated at USD 12.95 billion, growing from 2025 value of USD 12.2 billion with 2031 projections showing USD 17.42 billion, growing at 6.12% CAGR over 2026-2031.
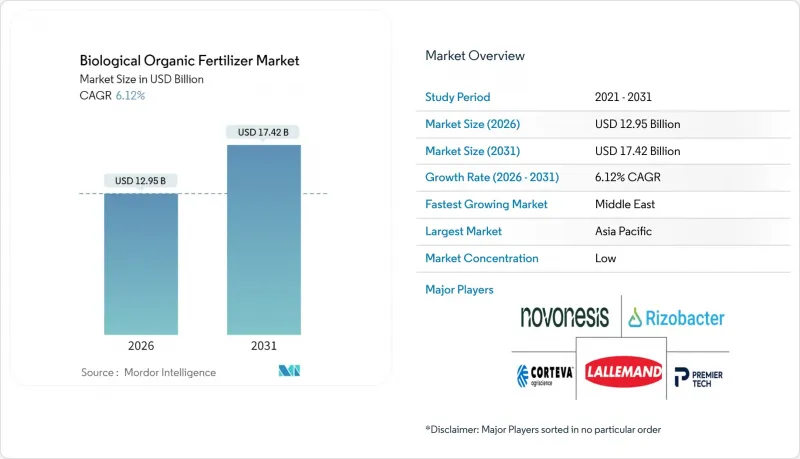
Strengthening synthetic-input regulations, expanding carbon-credit protocols, and rapid gains in microbial-consortia technology are reshaping producer economics and spurring demand across row-crop acreage. Federal and state incentives in the United States, aggressive soil-health mandates in China, and the European Union's carbon-border tariffs continue to raise the opportunity cost of conventional fertilizers, accelerating industry adoption. The Asia-Pacific region retains its primacy through large-scale national subsidy programs, while the Middle East registers the fastest growth, thanks to food-security investments that favor saline-tolerant biological inputs. Competitive differentiation now pivots on shelf-life innovation, encapsulation patents, and the integration of biofertilizers into bundled regenerative-agriculture service packages. Overall, the biological organic fertilizer market is on a structural growth path, with regulatory, climatic, and consumer forces aligning to deepen penetration far beyond specialty crops.
Global Biological Organic Fertilizer Market Trends and Insights
Federal Incentives for Regenerative Farming
Government subsidies are significantly reducing the payback periods for growers transitioning from synthetic nitrogen to microbial alternatives. The United States Department of Agriculture committed USD 3.1 billion under its Partnerships for Climate-Smart Commodities program in 2024, covering up to 50% of biological-input transition costs . India's direct-benefit-transfer scheme extends to biofertilizers, while China's 14th Five-Year Plan requires organic amendments on 30% of degraded farmland by 2026, ensuring steady demand. These measures collectively lower growers' capital risk, insulate national food systems from volatile natural-gas-linked urea prices, and underpin consistent volume growth for the biological organic fertilizer market.
Escalating Restrictions on Synthetic Fertilizers
The European Union's Carbon Border Adjustment Mechanism, fully effective in 2024, raised the landed cost of ammonia-based inputs by up to 20% . Cadmium caps on mineral phosphorus and China's nitrogen ceilings in the Yangtze River basin are increasing compliance costs, making biological substitutes the economically rational choice. Remote-sensing audits and license revocations provide real-time enforcement, creating a decisive pull for the biological organic fertilizer market across all row-crop segments.
Short Shelf-Life in High-Temperature Climates
Microbial populations decline by up to 80% after 90 days at 35 °C, eroding field efficacy in arid markets . Limited cold-chain infrastructure and higher formulation costs for encapsulation impede accessibility for smallholder growers. String Bio's methane-derived protein carrier stabilizes microbes at 45 °C but awaits widespread regulatory clearance. Until scalable solutions emerge, this restraint trims near-term gains for the biological organic fertilizer market.
Other drivers and restraints analyzed in the detailed report include:
- Soaring Demand from Organic Packaged-Food Processors
- Rapid Adoption of Microbial Consortia Blends
- Fragmented, Country-Specific Registration Hurdles
For complete list of drivers and restraints, kindly check the Table Of Contents.
Segment Analysis
Rhizobium retains a 31.65% biological organic fertilizer market share in 2025, while Mycorrhiza is expanding at an 8.53% CAGR, the highest among all product categories. These blended formulations synchronize the release of multiple nutrients, enabling growers to reduce synthetic inputs without incurring yield penalties. Enhanced root colonization and drought resilience further boost demand in rain-fed systems, particularly in Brazil and the United States. Manufacturers increasingly bundle consortia with seed coatings, ensuring uniform field application and simplifying logistics for large farms. Regulatory delays, persist because each microbial component requires a separate dossier. Despite that bottleneck, rising commodity-price volatility is nudging mainstream growers toward versatile consortia, guaranteeing steady growth for this high-value niche within the biological organic fertilizer market size.
Organic-residue products meeting growers' soil organic matter targets, but face unpredictability in mineralization rates that limit precision nutrient management. Fish meal and bone meal are key raw materials for aquaculture feed markets. Green manure application benefits from subsidies in regenerative agriculture. Oil cakes remain cost-effective but suffer from variable purity in unregulated channels. The contrast in growth trajectories underscores an industry shift: advanced microbial inputs increasingly capture share from slower-acting residue products, especially in high-value export horticulture where reliable nutrient timing is paramount.
The Biological Organic Fertilizer Market Report is Segmented by Type (Microorganism and Organic Residues), Application (Grains and Cereals, Pulses and Oilseeds, Fruits and Vegetables, and More), and Geography (North America, Europe, Asia-Pacific, and More). The Market Forecasts are Provided in Terms of Value (USD).
Geography Analysis
The Asia-Pacific region generated 39.78% of 2025 revenue, anchored by India's direct-benefit-transfer system and China's organic-matter mandates. Japan and Australia achieve incremental growth through export-driven horticulture, which requires certified inputs. Despite strong uptake, counterfeit products and fragmented smallholder plots complicate quality control and distribution. National Fertilizers Limited and Gujarat State Fertilizers and Chemicals Ltd. are scaling domestic microbial production, but consistency varies across state lines, creating opportunities for multinational entrants offering validated consortia.
North America and Europe jointly contribute to the current demand. The United States allocates USD 3.1 billion in grant funding to integrate biological inputs into corn and soybean systems, while Canada earmarks CAD 50 million (approximately USD 37 million) for pulse and canola projects that reduce greenhouse-gas emissions by up to 40%. The European Union's cadmium limits on mineral phosphate and carbon border tariffs further incentivize microbial substitution, although delays in member-state approval add cost and time. Grower cooperatives are increasingly negotiating collective supply agreements with leading biological manufacturers, securing volume discounts and field-support services.
The Middle East logs a robust 7.52% CAGR, the fastest worldwide, driven by the UAE's National Food Security Strategy and Saudi Arabia's SAR 10 billion (USD 2.7 billion) Vision 2030 irrigation upgrade. Biological inputs capable of tolerating saline conditions are well-suited for desalinated-water farming systems, thereby boosting adoption in controlled environments. South America, led by Brazil and Argentina, is leveraging decades of experience with soybean-based Rhizobium and new capacity expansions by regional producers, such as Rizobacter Argentina. Donor-funded pilot programs drive Africa's growth, although gaps in the cold chain and training deficits limit its near-term potential. Collectively, regional momentum reinforces the global resilience of the biological organic fertilizer market, diversifying its growth engines across both developed and emerging economies.
- Novonesis A/S
- Rizobacter Argentina S.A.
- Lallemand Inc.
- Premier Tech
- Symborg (Corteva Agriscience)
- National Fertilizers Limited
- Madras Fertilizers Limited
- T Stanes and Company Limited
- Gujarat State Fertilizers and Chemicals Ltd
- String Bio
- Rashtriya Chemicals and Fertilizers Ltd
- Agrinos
- Biomax Naturals
- Agri Life
- Biofosfatos do Brasil
- Kiwa Bio-Tech Products Group Corporation
- Protan AG
- Mapleton Agri Biotech Pty Limited
- Bio Nature Technology PTE Ltd.
- Kribhco
- Bio Ark Pte Ltd
- Savio BIO Organic and Fertilizers Private Limited
- ACI Biolife
Additional Benefits:
- The market estimate (ME) sheet in Excel format
- 3 months of analyst support
TABLE OF CONTENTS
1 Introduction
- 1.1 Study Assumptions and Market Definition
- 1.2 Scope of the Study
2 Research Methodology
3 Executive Summary
4 Market Landscape
- 4.1 Market Overview
- 4.2 Market Drivers
- 4.2.1 Federal incentives for regenerative farming
- 4.2.2 Escalating restrictions on synthetic fertilizers
- 4.2.3 Soaring demand from organic packaged-food processors
- 4.2.4 Rapid adoption of microbial consortia blends
- 4.2.5 Carbon-credit monetization for soil microbiome improvement
- 4.2.6 Biostimulant-biofertilizer co-formulation patents accelerating trials
- 4.3 Market Restraints
- 4.3.1 Short shelf-life in high-temperature climates
- 4.3.2 Fragmented, country-specific registration hurdles
- 4.3.3 Low farmer awareness outside specialty crops
- 4.3.4 Uncertainty around carbon-credit pricing models
- 4.4 Regulatory Landscape
- 4.5 Technological Outlook
- 4.6 Porter's Five Forces Analysis
- 4.6.1 Bargaining Power of Suppliers
- 4.6.2 Bargaining Power of Buyers
- 4.6.3 Threat of New Entrants
- 4.6.4 Threat of Substitute Products
- 4.6.5 Intensity of Competitive Rivalry
5 Market Size and Growth Forecasts (Value)
- 5.1 By Type
- 5.1.1 Microorganism
- 5.1.1.1 Rhizobium
- 5.1.1.2 Azotobacter
- 5.1.1.3 Azospirillum
- 5.1.1.4 Blue-green Algae
- 5.1.1.5 Phosphate Solubilizing Bacteria
- 5.1.1.6 Mycorrhiza
- 5.1.1.7 Other Microorganisms
- 5.1.2 Organic Residues
- 5.1.2.1 Green Manure
- 5.1.2.2 Fish Meal
- 5.1.2.3 Bone Meal
- 5.1.2.4 Oil Cakes
- 5.1.2.5 Others
- 5.1.1 Microorganism
- 5.2 By Application
- 5.2.1 Grains and Cereals
- 5.2.2 Pulses and Oilseeds
- 5.2.3 Fruits and Vegetables
- 5.2.4 Commercial Crops
- 5.2.5 Turf and Ornamentals
- 5.3 By Geography
- 5.3.1 North America
- 5.3.1.1 United States
- 5.3.1.2 Canada
- 5.3.1.3 Mexico
- 5.3.1.4 Rest of North America
- 5.3.2 Europe
- 5.3.2.1 Germany
- 5.3.2.2 United Kingdom
- 5.3.2.3 France
- 5.3.2.4 Spain
- 5.3.2.5 Italy
- 5.3.2.6 Russia
- 5.3.2.7 Rest of Europe
- 5.3.3 Asia-Pacific
- 5.3.3.1 China
- 5.3.3.2 Japan
- 5.3.3.3 India
- 5.3.3.4 Australia
- 5.3.3.5 Rest of Asia-Pacific
- 5.3.4 South America
- 5.3.4.1 Brazil
- 5.3.4.2 Argentina
- 5.3.4.3 Rest of South America
- 5.3.5 Middle East
- 5.3.5.1 Saudi Arabia
- 5.3.5.2 United Arab Emirates
- 5.3.5.3 Rest of Middle East
- 5.3.6 Africa
- 5.3.6.1 South Africa
- 5.3.6.2 Nigeria
- 5.3.6.3 Rest of Africa
- 5.3.1 North America
6 Competitive Landscape
- 6.1 Market Concentration
- 6.2 Strategic Moves
- 6.3 Market Share Analysis
- 6.4 Company Profiles (Includes Global Level Overview, Market Level Overview, Core Segments, Financials as Available, Strategic Information, Market Rank/Share for Key Companies, Products and Services, and Recent Developments)
- 6.4.1 Novonesis A/S
- 6.4.2 Rizobacter Argentina S.A.
- 6.4.3 Lallemand Inc.
- 6.4.4 Premier Tech
- 6.4.5 Symborg (Corteva Agriscience)
- 6.4.6 National Fertilizers Limited
- 6.4.7 Madras Fertilizers Limited
- 6.4.8 T Stanes and Company Limited
- 6.4.9 Gujarat State Fertilizers and Chemicals Ltd
- 6.4.10 String Bio
- 6.4.11 Rashtriya Chemicals and Fertilizers Ltd
- 6.4.12 Agrinos
- 6.4.13 Biomax Naturals
- 6.4.14 Agri Life
- 6.4.15 Biofosfatos do Brasil
- 6.4.16 Kiwa Bio-Tech Products Group Corporation
- 6.4.17 Protan AG
- 6.4.18 Mapleton Agri Biotech Pty Limited
- 6.4.19 Bio Nature Technology PTE Ltd.
- 6.4.20 Kribhco
- 6.4.21 Bio Ark Pte Ltd
- 6.4.22 Savio BIO Organic and Fertilizers Private Limited
- 6.4.23 ACI Biolife
7 Market Opportunities and Future Outlook

