
PUBLISHER: Mordor Intelligence | PRODUCT CODE: 1940652

PUBLISHER: Mordor Intelligence | PRODUCT CODE: 1940652
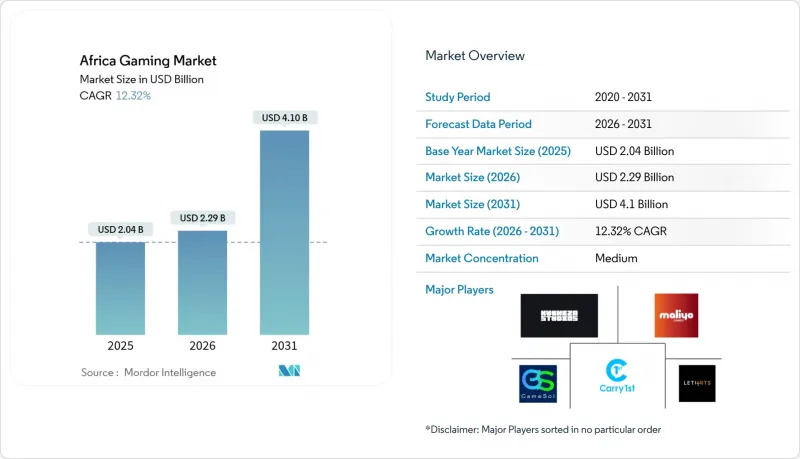
Africa Gaming - Market Share Analysis, Industry Trends & Statistics, Growth Forecasts (2026 - 2031)
Africa Gaming Market size in 2026 is estimated at USD 2.29 billion, growing from 2025 value of USD 2.04 billion with 2031 projections showing USD 4.10 billion, growing at 12.32% CAGR over 2026-2031.
The ecosystem's upward curve rests on smartphone ubiquity, fintech-enabled micro-transactions, and expanding edge-data-center capacity that shortens latency for cloud services. Mobile titles already supply nearly 90% of revenue, but cloud delivery is poised to reshape platform dynamics as infrastructure investments from Microsoft, Sony, and regional telcos come online. Local studios capitalize on cultural storytelling to engage first-time gamers, and international publishers reinforce that content pipeline through equity stakes and co-development deals. Regulatory decisions such as South Africa's decision to drop the 9% excise duty on low-cost handsets underscore policy momentum toward digital inclusion. Headwinds persist in the form of inconsistent power supply, hardware tariffs, and fragmented intellectual-property enforcement, yet momentum in e-sports leagues and fintech innovation offsets many structural risks.
Africa Gaming Market Trends and Insights
Surging Smartphone Penetration and Affordable Data Plans
Shipments climbed 6% year-on-year to 19.4 million units in Q1 2025, with North Africa recording 34% growth. TRANSSION continues to command a 47% share, reflecting its mastery of entry-level pricing that aligns with local income levels. More than 95% of the continent's 349 million gamers play on mobile, reinforcing the platform's primacy. The proliferation of 4G-enabled phones, 85% of total shipments, elevates user readiness for data-heavy titles. A median age below 20 ensures a pipeline of digital natives that treat mobile gaming as a primary entertainment outlet rather than an occasional pastime.
Increasing Localisation of Content and Language Support
Disney's "Iwaju" partnership with Nigeria's Maliyo Games marks a watershed as global IP leans on African storytelling for authenticity. Localization studies show 76% of consumers prefer experiences in their native language, and the continent's 3,000 cultures make cultural resonance a decisive retention lever. Kiro'o Games' milestone Xbox launch illustrates the pay-off: culturally grounded titles enjoy longer session times and higher conversion rates. French, Arabic, and Swahili versions widen addressable audiences, while vernacular voice-overs enrich narrative immersion. Studios that master cultural nuance secure stronger monetization metrics and attract cross-media licensing.
High Import Tariffs on Consoles and PC Hardware
Kenya's 25% duty plus 16% VAT inflates console prices to multiples of the monthly median income, discouraging adoption. South Africa's zero-duty console policy, but 15% VAT, highlights regional disparities that fragment addressable demand. Tariffs curtail gaming-cafe rollouts, limiting community hubs for e-sports qualification events. Hardware cost barriers push consumers toward mobile or cloud alternatives, unintentionally accelerating the Africa gaming market's post-console trajectory. Government leniency on low-cost handsets hints at potential tariff reconsideration for gaming devices, but timelines remain uncertain.
Other drivers and restraints analyzed in the detailed report include:
- Expansion of Mobile-Money and Fintech Micro-Transactions
- Government E-Sports Initiatives and National Leagues
- Persistent Electricity Reliability Issues
For complete list of drivers and restraints, kindly check the Table Of Contents.
Segment Analysis
Smartphones generated 61.15% of 2025 revenue, underscoring that the Africa gaming market size leans heavily on mobile-first engagement. The Africa gaming market share of smartphones benefits from affordable entry-level devices and zero-rated gaming data offers from telcos. Cloud gaming, however, is scaling fastest at a 13.72% CAGR on the back of hyperscale data-center investment, promising console-grade experiences without hardware imports. Tablets remain niche, catering to educational titles consumed by families. Console uptake lags owing to tariff drag, positioning cloud services as a viable detour around customs costs.
Growth vectors align with telco-OTT bundles that package gaming subscriptions, edge caching that compresses latency, and pay-as-you-go micro-payments that democratize access. Browser PC titles retain traction among urban professionals who game during work breaks, while downloaded PC games confront bandwidth ceilings. As infrastructure matures, cloud platforms may cannibalize high-end PC and console segments, but smartphones will continue to anchor user-acquisition funnels for the Africa gaming market.
Action/adventure titles held a 33.05% share in 2025, buoyed by casual control schemes and relatable story arcs drawn from African folklore. MOBA's projected 13.28% CAGR rides on the March 2025 League of Legends server that removed latency penalties for competitive play. Sports franchises, especially football, sustain consistent monetization through annual roster updates. Shooter/FPS adoption is slower because of high data loads and sociocultural sensitivities to violent themes. Casual puzzle apps excel at onboarding, while simulation games attract mature demographics with strategic depth.
The genre mix illustrates the Africa gaming industry's maturation: early adopters gravitate to short-session casual play, and rising infrastructure capacity ushers in skill-based competitive formats. Local studios localize mythic narratives, nudging conversion by resonating with cultural archetypes. As competitive gaming prize pools rise, MOBA may overtake action titles in revenue, but action's evergreen appeal ensures steady floor demand.
The Africa Gaming Market Report is Segmented by Platform (Browser PC, Downloaded/Box PC, Gaming Console, Smartphone, Tablet, and Cloud Gaming), Game Genre (Action/Adventure, Sports, Shooter/FPS, and More), Revenue Model (Premium, Free-To-Play With In-App Purchases, Subscription, and More), Gamer Demographics (Age <18, Age 18-35, and More), and County. The Market Forecasts are Provided in Terms of Value (USD).
List of Companies Covered in this Report:
- Carry1st (Pty) Ltd.
- Maliyo Games Ltd.
- Leti Arts Ltd.
- Kucheza Gaming Ltd.
- Gamesole Ltd.
- Kuluya Ltd.
- ChopUp Interactive Ltd.
- Nyamakop Pty Ltd.
- Kagiso Interactive Pty Ltd.
- Celestial Games Pty Ltd.
- Clockwork Acorn Pty Ltd.
- Tencent Holdings Ltd.
- NetEase Inc.
- Riot Games Inc.
- Gameloft SE
- Kwalee Ltd.
- Ubisoft Entertainment SA
- Take-Two Interactive Software Inc.
- Electronic Arts Inc.
- Activision Blizzard Inc.
- Netmarble Corp.
- Miniclip SA
Additional Benefits:
- The market estimate (ME) sheet in Excel format
- 3 months of analyst support
TABLE OF CONTENTS
1 INTRODUCTION
- 1.1 Study Assumptions and Market Definition
- 1.2 Scope of the Study
2 RESEARCH METHODOLOGY
3 EXECUTIVE SUMMARY
4 MARKET LANDSCAPE
- 4.1 Market Overview
- 4.2 Market Drivers
- 4.2.1 Surging smartphone penetration and affordable data plans
- 4.2.2 Increasing localisation of content and language support
- 4.2.3 Expansion of mobile?money and fintech micro-transactions
- 4.2.4 Government e-sports initiatives and national leagues
- 4.2.5 Cloud-gaming infrastructure roll-outs (edge data centres)
- 4.2.6 Africa-specific ad-tech platforms boosting F2P monetisation
- 4.3 Market Restraints
- 4.3.1 High import tariffs on consoles and PC hardware
- 4.3.2 Persistent electricity reliability issues
- 4.3.3 Limited local venture funding for studios
- 4.3.4 Patchy enforcement of digital-IP protection laws
- 4.4 Industry Value Chain Analysis
- 4.5 Regulatory Landscape
- 4.6 Technological Outlook
- 4.7 Porter's Five Forces Analysis
- 4.7.1 Bargaining Power of Suppliers
- 4.7.2 Bargaining Power of Consumers
- 4.7.3 Threat of New Entrants
- 4.7.4 Threat of Substitute Products
- 4.7.5 Intensity of Competitive Rivalry
- 4.8 Impact of Macroeconomic Factors on the Market
5 MARKET SIZE AND GROWTH FORECASTS (VALUES)
- 5.1 By Platform
- 5.1.1 Browser PC
- 5.1.2 Downloaded/Box PC
- 5.1.3 Gaming Console
- 5.1.4 Smartphone
- 5.1.5 Tablet
- 5.1.6 Cloud Gaming
- 5.2 By Game Genre
- 5.2.1 Action/Adventure
- 5.2.2 Sports
- 5.2.3 Shooter/FPS
- 5.2.4 MOBA
- 5.2.5 Casual/Puzzle
- 5.2.6 Simulation/Strategy
- 5.3 By Revenue Model
- 5.3.1 Premium (Pay-to-Play)
- 5.3.2 Free-to-Play with In-App Purchases
- 5.3.3 Subscription (Game Pass, Apple Arcade etc.)
- 5.3.4 In-Game Advertising
- 5.3.5 Esports Media and Sponsorship
- 5.4 By Gamer Demographics
- 5.4.1 Age <18
- 5.4.2 Age 18-35
- 5.4.3 Age 36-50
- 5.4.4 Age >50
- 5.5 By Country
- 5.5.1 Nigeria
- 5.5.2 South Africa
- 5.5.3 Egypt
- 5.5.4 Kenya
- 5.5.5 Algeria
- 5.5.6 Rest of Africa
6 COMPETITIVE LANDSCAPE
- 6.1 Market Concentration
- 6.2 Strategic Moves
- 6.3 Market Share Analysis
- 6.4 Company Profiles (includes Global-level Overview, Market-level Overview, Core Segments, Financials as available, Strategic Information, Market Rank/Share, Products and Services, Recent Developments)
- 6.4.1 Carry1st (Pty) Ltd.
- 6.4.2 Maliyo Games Ltd.
- 6.4.3 Leti Arts Ltd.
- 6.4.4 Kucheza Gaming Ltd.
- 6.4.5 Gamesole Ltd.
- 6.4.6 Kuluya Ltd.
- 6.4.7 ChopUp Interactive Ltd.
- 6.4.8 Nyamakop Pty Ltd.
- 6.4.9 Kagiso Interactive Pty Ltd.
- 6.4.10 Celestial Games Pty Ltd.
- 6.4.11 Clockwork Acorn Pty Ltd.
- 6.4.12 Tencent Holdings Ltd.
- 6.4.13 NetEase Inc.
- 6.4.14 Riot Games Inc.
- 6.4.15 Gameloft SE
- 6.4.16 Kwalee Ltd.
- 6.4.17 Ubisoft Entertainment SA
- 6.4.18 Take-Two Interactive Software Inc.
- 6.4.19 Electronic Arts Inc.
- 6.4.20 Activision Blizzard Inc.
- 6.4.21 Netmarble Corp.
- 6.4.22 Miniclip SA
7 MARKET OPPORTUNITIES AND FUTURE OUTLOOK
- 7.1 White-space and Unmet-Need Assessment

