
PUBLISHER: Mordor Intelligence | PRODUCT CODE: 1940704

PUBLISHER: Mordor Intelligence | PRODUCT CODE: 1940704
United States Distribution Transformer - Market Share Analysis, Industry Trends & Statistics, Growth Forecasts (2026 - 2031)
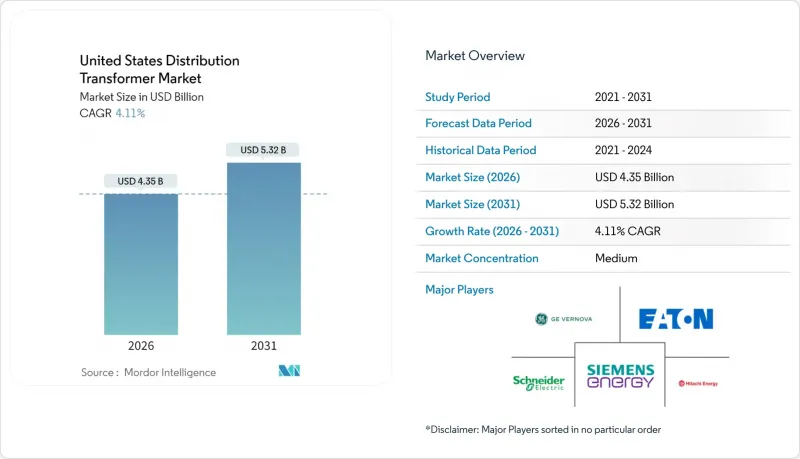
The United States Distribution Transformer Market is expected to grow from USD 4.18 billion in 2025 to USD 4.35 billion in 2026 and is forecast to reach USD 5.32 billion by 2031 at 4.11% CAGR over 2026-2031.
Current expansion is driven by simultaneous federal infrastructure spending, the electrification of transportation and industry, and urgent grid modernization programs. Lead-time inflation, which has stretched delivery cycles from roughly 50 weeks in 2021 to nearly two years in 2024, is prompting utilities to secure long-term supply agreements well in advance of project start dates. The new DOE efficiency rules finalized in April 2024 are accelerating asset-replacement schedules ahead of 2029 compliance, while Buy American provisions are stimulating new domestic capacity. At the same time, more than 70% of in-service units are now older than 25 years, creating a sizable installed-base replacement opportunity whose timing coincides with the expected surge in electrification load.
United States Distribution Transformer Market Trends and Insights
Rising Electricity Demand & Electrification Wave
The adoption of electric vehicles, industrial heat process electrification, and steady population migration into high-growth Sun Belt states are pushing peak-load forecasts well above pre-2020 trajectories. NREL modeling indicates that distribution-level capacity must increase by 160-260% by 2050 to meet the combined load from residential, commercial, industrial, and transportation sectors. Utilities across Texas and Florida have already filed multi-year capital plans that earmark more than 40% of distribution spending for transformer replacements and additions. Widening load-growth disparity among regions is creating equipment shortages in fast-growing counties, forcing utilities to pre-purchase inventory to avoid service curtailments. Manufacturers able to scale production of medium-capacity units are positioned to benefit the most, as this rating class aligns with the majority of new substation builds. The United States distribution transformer market is therefore expected to remain supply-constrained through at least 2027 as aggregate demand tracks electrification curves rather than normal economic cycles.
Grid-Modernization Funding Under IIJA & DOE Programs
The Infrastructure Investment and Jobs Act (IIJA) earmarked USD 3.5 billion for 58 grid-resilience projects in 44 states, with 64% of these dollars targeting distribution-level assets, including reclosers, sectionalizers, and transformers. Texas alone has USD 1.65 billion of transmission and distribution projects breaking ground in Q2 2025, equating to 33% of nationwide T&D construction starts. With much of the original 1990s vintage installed base approaching end-of-life, the timing of federal funds is amplifying the replacement wave. DOE's 2024 efficiency final rule also incentivizes utilities to accelerate replacement cycles before the 2029 compliance cliff, avoiding stranded-asset risk for newly installed but non-compliant units. Collectively, these measures lift the United States distribution transformer market by providing budget certainty and backstopping utility capital plans.
Volatile Copper & GOES Prices Inflating Capex
Copper spot prices climbed 60-80% between 2020 and 2024, while grain-oriented electrical steel (GOES) nearly doubled over the same period. Because windings and core account for more than 70% of material input cost, such volatility can shift delivered pricing by USD 3,000-6,000 per MVA for medium-capacity units. Utilities respond by seeking fixed-index price clauses, but manufacturers often cap such exposure to three months, forcing either budget re-openings or project delays. Larger investor-owned utilities can hedge through multi-year frame agreements, whereas smaller cooperatives tend to defer replacements, suppressing short-term volume.
Other drivers and restraints analyzed in the detailed report include:
- Renewable & DER Integration Creating Bi-Directional Load Flows
- Domestic Sourcing Rules Spurring On-Shoring of Transformer Manufacturing
- Tight U.S. GOES Supply Chain Extending Transformer Lead Times
For complete list of drivers and restraints, kindly check the Table Of Contents.
Segment Analysis
The United States distribution transformer market size for medium-capacity units (10-100 MVA) reached USD 1.71 billion in 2025 and is projected to expand at a 9.12% CAGR to USD 2.89 billion by 2031. The segment controls the largest revenue share at 40.92%, reflecting its suitability for substation build-outs that bridge transmission and distribution systems. Utility capital-planning documents consistently allocate over 45% of upcoming substation equipment budgets to the 25-60 MVA range, underscoring the crucial role of this range in grid capacity growth.
Manufacturers benefit from repeatable designs that shorten quoting cycles and leverage modular tank platforms, yielding cost-saving benefits that protect margins despite raw material volatility. DOE's 2029 efficiency thresholds tighten total loss allowances most aggressively in this rating band, placing a premium on amorphous-core options that improve no-load loss by up to 30%. Medium-capacity products are therefore the focal point for digital monitoring add-ons, including dissolved-gas sensors and edge gateways, helping vendors secure after-sales service revenue. The United States distribution transformer market continues to rely on this class because it addresses both new-build data center supply and traditional distribution and feeder reinforcement.
Oil-filled transformers contributed USD 3.36 billion, or 80.45% of total revenue, in 2025 and are expected to grow at 3.96% through 2031, maintaining their numeric dominance despite stricter spill-containment regulations. High dielectric strength and economical cost make mineral-oil designs the go-to solution for rural and utility substation installations. The United States distribution transformer market share for air-cooled variants remains modest; however, their faster 9.36% CAGR elevates the segment's importance, where fire safety drives specification decisions.
Data centers and hospital campuses located in dense metropolitan areas are increasingly specifying dry-type epoxy cast-coil designs, which reduce the footprint and eliminate oil-catch basins mandated by fire code. DOE's pending Tier 2 efficiency rules indirectly favor air-cooled transformers because their low-loss cores reduce heat load, offsetting the lower thermal conductivity of air. Sustainability narratives further boost demand for biodegradable ester-fluid hybrids that blend oil-cooled thermal performance with enhanced fire safety. Consequently, air-cooled technology represents the primary innovation vector and is likely to capture an incremental share of the United States distribution transformer market over the forecast horizon.
The United States Distribution Transformer Market Report is Segmented by Power Rating (Large, Medium, and Small), Cooling Type (Air-Cooled and Oil-Cooled), Phase (Single-Phase and Three-Phase), and End-User (Power Utilities, Industrial, Commercial, and Residential). The Market Sizes and Forecasts are Provided in Terms of Value (USD).
List of Companies Covered in this Report:
- Hitachi Energy (ABB)
- Siemens Energy
- Eaton Corporation
- GE Vernova (Prolec GE & SPX)
- Schneider Electric
- Howard Industries
- ERMCO
- Central Moloney
- Virginia Transformer Corp.
- Hammond Power Solutions
- Mitsubishi Electric Power Products
- WEG Electric
- Delta Star
- Pioneer Power Solutions
- Pacific Crest Transformers
- MGM Transformer Company
- SGB-SMIT Group
- SPX Transformer Solutions
- Howard Power Solutions
Additional Benefits:
- The market estimate (ME) sheet in Excel format
- 3 months of analyst support
TABLE OF CONTENTS
1 Introduction
- 1.1 Study Assumptions & Market Definition
- 1.2 Scope of the Study
2 Research Methodology
3 Executive Summary
4 Market Landscape
- 4.1 Market Overview
- 4.2 Market Drivers
- 4.2.1 Rising electricity demand & electrification wave
- 4.2.2 Grid-modernization funding under IIJA & DOE programs
- 4.2.3 Renewable & DER integration creating bi-directional load flows
- 4.2.4 Domestic sourcing rules spurring on-shoring of transformer manufacturing
- 4.2.5 Data-center cluster build-outs requiring medium-voltage distribution upgrades
- 4.2.6 Federal & state EV-charging corridor mandates
- 4.3 Market Restraints
- 4.3.1 Distributed generation cannibalizing peak-load growth
- 4.3.2 Volatile copper & GOES prices inflating capex
- 4.3.3 Tight U.S. GOES supply chain extending transformer lead times
- 4.3.4 2027 DOE efficiency rules raising compliance costs
- 4.4 Supply-Chain Analysis
- 4.5 Regulatory Landscape
- 4.6 Technological Outlook
- 4.7 Porter's Five Forces
- 4.7.1 Threat of New Entrants
- 4.7.2 Bargaining Power of Buyers
- 4.7.3 Bargaining Power of Suppliers
- 4.7.4 Threat of Substitutes
- 4.7.5 Competitive Rivalry
- 4.8 PESTLE Analysis
5 Market Size & Growth Forecasts
- 5.1 By Power Rating
- 5.1.1 Large (Above 100 MVA)
- 5.1.2 Medium (10 to 100 MVA)
- 5.1.3 Small (Up to 10 MVA)
- 5.2 By Cooling Type
- 5.2.1 Air-cooled
- 5.2.2 Oil-cooled
- 5.3 By Phase
- 5.3.1 Single-Phase
- 5.3.2 Three-Phase
- 5.4 By End-User
- 5.4.1 Power Utilities (includes, Renewables, Non-renewables, and T&D)
- 5.4.2 Industrial
- 5.4.3 Commercial
- 5.4.4 Residential
6 Competitive Landscape
- 6.1 Market Concentration
- 6.2 Strategic Moves (M&A, Partnerships, PPAs)
- 6.3 Market Share Analysis (Market Rank/Share for key companies)
- 6.4 Company Profiles (includes Global level Overview, Market level overview, Core Segments, Financials as available, Strategic Information, Products & Services, and Recent Developments)
- 6.4.1 Hitachi Energy (ABB)
- 6.4.2 Siemens Energy
- 6.4.3 Eaton Corporation
- 6.4.4 GE Vernova (Prolec GE & SPX)
- 6.4.5 Schneider Electric
- 6.4.6 Howard Industries
- 6.4.7 ERMCO
- 6.4.8 Central Moloney
- 6.4.9 Virginia Transformer Corp.
- 6.4.10 Hammond Power Solutions
- 6.4.11 Mitsubishi Electric Power Products
- 6.4.12 WEG Electric
- 6.4.13 Delta Star
- 6.4.14 Pioneer Power Solutions
- 6.4.15 Pacific Crest Transformers
- 6.4.16 MGM Transformer Company
- 6.4.17 SGB-SMIT Group
- 6.4.18 SPX Transformer Solutions
- 6.4.19 Howard Power Solutions
7 Market Opportunities & Future Outlook
- 7.1 White-space & Unmet-Need Assessment

