
PUBLISHER: Mordor Intelligence | PRODUCT CODE: 2044203

PUBLISHER: Mordor Intelligence | PRODUCT CODE: 2044203
Dry-Mix Mortar Additives And Chemicals - Market Share Analysis, Industry Trends & Statistics, Growth Forecasts (2026 - 2031)
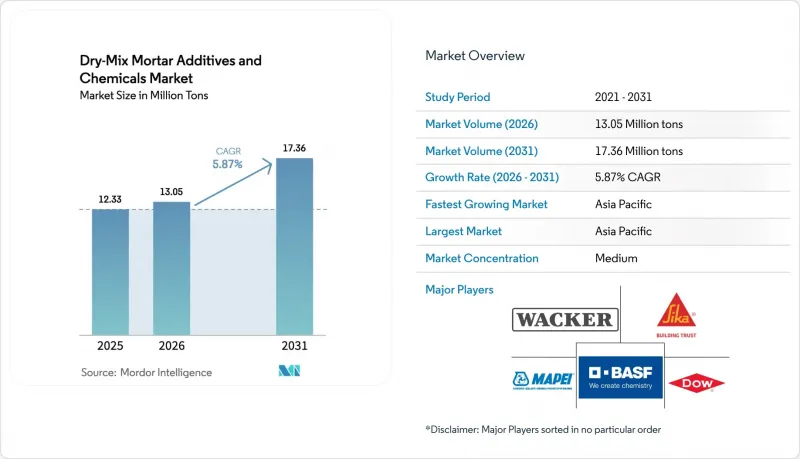
The Dry-Mix Mortar Additives and Chemicals Market size is expected to increase from 12.33 million tons in 2025 to 13.05 million tons in 2026 and reach 17.36 million tons by 2031, growing at a CAGR of 5.87% over 2026-2031.
Robust public-sector spending in India and accelerated industrial works in China underpin volume gains, while dust-control ordinances in the United States and European renovation mandates institutionalize factory-blended mortars as the default procurement path. Producers with vertically integrated polymer chains absorb raw-material volatility better than regional blenders, securing long-term contracts for metro-rail, bridge-deck, and EIFS retrofits. Vinyl acetate monomer and acrylic acid price swings remain the chief margin threat, although suppliers hedged by in-house monomer production shield end-users from quarterly list-price shocks. Equipment-intensive dry-mix plants act as a deterrent for new entrants, effectively locking in incumbents' technical-service relationships across Asia-Pacific transport megaprojects and Europe's Retrofit Wave.
Global Dry-Mix Mortar Additives And Chemicals Market Trends and Insights
Rising Construction Activity in Asia-Pacific
India's Union Budget 2026 allocated INR 12.2 lakh crore (USD 146 billion) for capital expenditure, with ₹5.98 lakh crore for transport infrastructure and INR 85,522 crore for urban development, driving demand for high-performance construction materials like tile adhesives and waterproofing mortars. China's construction sector, despite a 10.6% property-investment decline in 2024, is shifting toward industrial and logistics facilities, leveraging dry-mix mortars for efficiency amid a shrinking workforce. Southeast Asia, led by Vietnam and Indonesia, is adopting pre-mixed formulations to meet World Bank-mandated ASTM C1714 standards for infrastructure projects. However, supply-chain risks, such as typhoons disrupting polymer-powder shipments, pose challenges. The region's 6.65% forecast CAGR depends on sustained public-sector capex, though fiscal constraints in debt-laden provinces may slow new tenders after 2028.
Long-Term Cost Efficiency in Construction
Contractors using factory-blended dry-mix mortars have reduced material waste to under 2%, saving USD 8,000-12,000 annually for mid-sized residential projects. Labor productivity has improved, saving 3-4 hours per 1,000-square-foot application by eliminating on-site batching errors. These benefits, significant in wage-inflated markets like the United Arab Emirates (UAE) and Singapore, require an upfront investment of USD 150,000-250,000 in silo storage and pneumatic systems, limiting adoption in fragmented markets like India's Tier-2 cities. A 2025 study by IIT (Indian Institute of Technology) Delhi showed polymer-modified renders extended facade-maintenance cycles from 7 to 12 years, cutting lifecycle costs by 23%. This has driven procurement committees to favor pre-qualified dry-mix suppliers, strengthening incumbents with established technical-service networks.
High Capex for Dry-Mix Plants
Establishing a 200,000-ton-per-year dry-mix mortar plant requires USD 50-70 million in capital expenditure, covering silo arrays, computerized batching systems, and ISO 14001-compliant dust-collection infrastructure. High financing rates (9-12%) in markets like Indonesia and the Philippines deter regional players. Smaller formulators often lease toll-manufacturing capacity, losing 15-20% margins and control over formulation IP, limiting customization. Wacker's Nanjing facility, operational since 2024, exemplifies scale economies with a EUR 80 million (USD 87 million) investment supporting 60,000 tons of dispersible-polymer-powder capacity through multi-year offtake agreements. In contrast, mid-tier suppliers in Gujarat and Tamil Nadu operate smaller plants (20,000-40,000 tons/year) with batch variability, disqualifying them from precast-concrete tenders. The top 10 producers control 55% of global capacity, while over 200 regional blenders share the remaining 45%.
Other drivers and restraints analyzed in the detailed report include:
- Growing Renovation and Retrofit Demand in Europe
- Government Dust-Control Mandates
- Volatility in Specialty-Polymer Prices
For complete list of drivers and restraints, kindly check the Table Of Contents.
Segment Analysis
Additives represented 93.20% of volume in 2025 and are set to grow with a CAGR of 5.94% during the forecast period (2026-2031). Redispersible polymer powders remain the anchor sub-segment, essential for EN 12004-C2 tile adhesives across Asia-Pacific's residential towers. Hydroxypropyl methylcellulose, at USD 3,200-4,500/ton, underpins self-leveling screeds in data centers, enabling +-3 mm flatness over 2 m spans. Air-entraining agents see episodic spikes in Canada's freeze-thaw bridge works, yet trail polymer powders in volume.
Chemicals power niche roles. Anhydrite shrinkage compensators curb cracking in automated-warehouse slabs, while accelerators support winter pours in the Baltics. EU REACH (European Union Registration, Evaluation, Authorisation and Restriction of Chemicals) compliance fees of EUR 200,000-500,000 per variant deter mid-tier innovation, consolidating supply around multi-national incumbents.
The Dry-Mix Mortar Additives and Chemicals Market Report is Segmented by Type (Additives and Chemicals), by End-User Industry (Residential and Non-Residential), and Geography (Asia-Pacific, North America, Europe, South America, and the Middle East and Africa). The Market Size and Forecasts for Dry-Mix Mortar Additives and Chemicals are Done in Volume (Tons).
Geography Analysis
Asia-Pacific held a 36.59% share in 2025, advancing with a CAGR of 6.65% during the forecast period (2026-2031). India's expressways and metros consume polymer-modified mortars at rates 30-40% above estimates because of monsoon-driven rework. China's state enterprise pipeline shifts volume into industrial parks and high-speed rail depots. Southeast Asia imports 25-35% of pre-mixed mortars due to ISO 9001 gaps, inflating landed costs but guaranteeing ASTM-grade quality.
Europe's Renovation Wave props stable but slower growth; Germany's Exterior Insulation and Finish Systems (EIFS) retrofits demand up to 15 kg base coat m2, while UK BS 8414 fire tests narrow the supplier base to three certified producers. North American infrastructure funds back-load demand, with bridge-deck overlays peaking post-2027. Saudi Arabia's USD 1.3 trillion Vision 2030 program injects episodic but premium-priced spikes, offset by project-timeline slippage.
- AGRANA Beteiligungs AG
- Ashland
- Avebe
- BASF SE
- Celanese Corporation
- CEMEX S.A.B. de CV
- Chemstar Products Company
- DCC
- Don Construction Products Ltd
- Dow
- Emsland Group
- Evonik Industries AG
- Innospec
- Kima Chemical Co. Ltd
- LOTTE Fine Chemical
- Mapei SpA
- Nouryon
- Rudolf GmbH
- SE Tylose GmbH & Co. KG (ShinEtsu)
- Shandong Head Co. Ltd
- SIDLEY CHEMICAL CO. LTD
- Sika AG
- SMScor
- The Euclid Chemical Company
- Wacker Chemie AG
- Berolan GmbH
Additional Benefits:
- The market estimate (ME) sheet in Excel format
- 3 months of analyst support
TABLE OF CONTENTS
1 Introduction
- 1.1 Study Assumptions and Market Definition
- 1.2 Scope of the Study
2 Research Methodology
3 Executive Summary
4 Market Landscape
- 4.1 Drivers
- 4.1.1 Rising construction activity in Asia-Pacific
- 4.1.2 Long-term cost efficiency in construction
- 4.1.3 Growing renovation and retrofit demand in Europe
- 4.1.4 Government mandates for pre-mixed mortars (dust-control)
- 4.1.5 Synergies with 3D-printing and modular construction
- 4.2 Restraints
- 4.2.1 High capex for dry-mix plants
- 4.2.2 Volatility in specialty-polymer prices
- 4.2.3 Stringent VOC and dust-emission regulations
- 4.3 Industry Value Chain Analysis
- 4.4 Porter's Five Forces Analysis
- 4.4.1 Bargaining Power of Suppliers
- 4.4.2 Bargaining Power of Consumers
- 4.4.3 Threat of New Entrants
- 4.4.4 Threat of Substitute Products and Services
- 4.4.5 Degree of Competition
5 Market Size & Growth Forecasts (Volume)
- 5.1 By Type
- 5.1.1 Additives
- 5.1.1.1 Redispersible Polymer Powder
- 5.1.1.2 Plasticizers
- 5.1.1.3 Defoamers
- 5.1.1.4 Cellulose Ether
- 5.1.1.5 Air Entraining Agents
- 5.1.1.6 Other Additives
- 5.1.2 Chemicals
- 5.1.2.1 Shrinkage (Anhydrites)
- 5.1.2.2 Retarders
- 5.1.2.3 Accelerators
- 5.1.1 Additives
- 5.2 By End-User Industry
- 5.2.1 Residential
- 5.2.2 Non-Residential
- 5.2.2.1 Commercial
- 5.2.2.2 Industrial and Institutional
- 5.2.2.3 Infrastructure
- 5.3 By Geography
- 5.3.1 Asia-Pacific
- 5.3.1.1 China
- 5.3.1.2 India
- 5.3.1.3 Japan
- 5.3.1.4 South Korea
- 5.3.1.5 Rest of Asia-Pacific
- 5.3.2 North America
- 5.3.2.1 United States
- 5.3.2.2 Canada
- 5.3.2.3 Mexico
- 5.3.3 Europe
- 5.3.3.1 Germany
- 5.3.3.2 United Kingdom
- 5.3.3.3 Italy
- 5.3.3.4 France
- 5.3.3.5 Rest of Europe
- 5.3.4 South America
- 5.3.4.1 Brazil
- 5.3.4.2 Argentina
- 5.3.4.3 Rest of South America
- 5.3.5 Middle East and Africa
- 5.3.5.1 Saudi Arabia
- 5.3.5.2 South Africa
- 5.3.5.3 Rest of Middle East and Africa
- 5.3.1 Asia-Pacific
6 Competitive Landscape
- 6.1 Market Concentration
- 6.2 Strategic Moves
- 6.3 Market Share(%)/Ranking Analysis
- 6.4 Company Profiles (includes Global Overview, Market Overview, Core Segments, Financials, Strategic Information, Products and Services, Recent Developments)
- 6.4.1 AGRANA Beteiligungs AG
- 6.4.2 Ashland
- 6.4.3 Avebe
- 6.4.4 BASF SE
- 6.4.5 Celanese Corporation
- 6.4.6 CEMEX S.A.B. de CV
- 6.4.7 Chemstar Products Company
- 6.4.8 DCC
- 6.4.9 Don Construction Products Ltd
- 6.4.10 Dow
- 6.4.11 Emsland Group
- 6.4.12 Evonik Industries AG
- 6.4.13 Innospec
- 6.4.14 Kima Chemical Co. Ltd
- 6.4.15 LOTTE Fine Chemical
- 6.4.16 Mapei SpA
- 6.4.17 Nouryon
- 6.4.18 Rudolf GmbH
- 6.4.19 SE Tylose GmbH & Co. KG (ShinEtsu)
- 6.4.20 Shandong Head Co. Ltd
- 6.4.21 SIDLEY CHEMICAL CO. LTD
- 6.4.22 Sika AG
- 6.4.23 SMScor
- 6.4.24 The Euclid Chemical Company
- 6.4.25 Wacker Chemie AG
- 6.4.26 Berolan GmbH
7 Market Opportunities and Future Outlook
- 7.1 Increase in demand for Eco Friendly Construction

