
PUBLISHER: Mordor Intelligence | PRODUCT CODE: 2061974

PUBLISHER: Mordor Intelligence | PRODUCT CODE: 2061974
Pea Fiber - Market Share Analysis, Industry Trends & Statistics, Growth Forecasts (2026 - 2031)
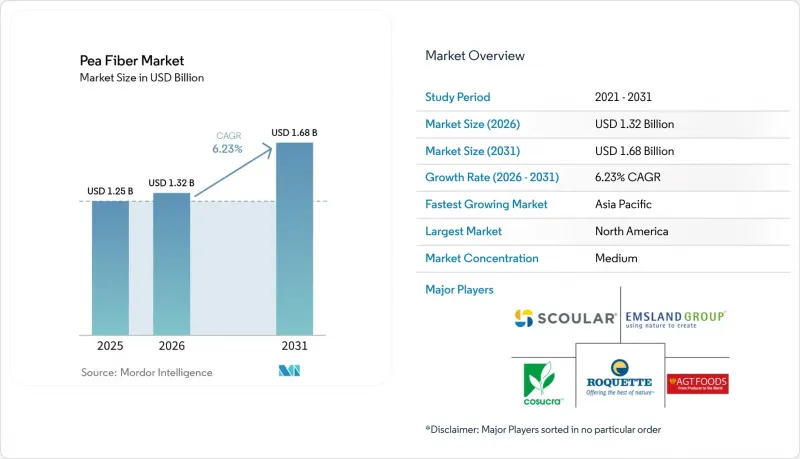
According to Mordor Intelligence, the pea fiber market size is projected to expand from USD 1.25 billion in 2025 and USD 1.30 billion in 2026 to USD 1.68 billion by 2031, registering a CAGR of 5.3% between 2026 and 2031.
This report is Segmented by Category (Conventional, Natural/Organic), Application (Food and Beverages, Dietary Supplements, Pet Food and Animal Feed, Pharmaceuticals, Other Application), and Geography (North America, Europe, Asia-Pacific, South America, Middle East and Africa). The Market Forecasts are Provided in Terms of Value (USD) and Volume (tons).
Global Pea Fiber Market Trends and Insights
Rising Adoption of Plant-Based and Vegan Diets
Pea fiber is becoming increasingly important in plant-based foods because it supports texture, moisture retention, and fat replacement in meat alternatives and dairy-free products. In 2025, Lantmannen announced a EUR 105 million investment in a new yellow pea processing facility in Lidkoping, Sweden, scheduled for commissioning in the first half of 2027. The plant is expected to produce 7,000 tonnes of protein isolate annually from 35,000 tonnes of yellow peas. As food manufacturers expand plant-based product offerings, they often reformulate products to improve both texture and nutritional value, increasing the use of pea fiber as a complementary ingredient. As a result, growth in the pea fiber market is frequently driven by the wider adoption of pea-based ingredients rather than by demand for fiber alone. With plant-based applications expanding across multiple food categories, the pea fiber market is expected to benefit from a broader and more stable demand foundation.
Growth in Gluten-Free Food Manufacturing
Gluten-free food production continues to support growth in the pea fiber market because removing wheat often creates challenges related to texture and moisture retention, which pea fiber can address without introducing common allergens. According to the USDA Economic Research Service, U.S. dry pea net exports increased by 40% during the 2024/25 marketing year, partly driven by rising domestic demand for value-added pulse-based ingredients . Food manufacturers are increasingly viewing pea fiber not simply as a nutritional enhancement, but as a core structural component in gluten-free formulations. This shift helps reduce product development and testing time while supporting consistent repeat use across bakery, pasta, and snack applications. In addition, pea fiber's clean-label appeal strengthens its competitive position against more technically complex hydrocolloid systems in both North American and European markets.
Volatility in Yellow Pea Prices and Supply Availability
Trade-driven volatility in yellow pea pricing emerged as a significant near-term constraint on the pea fiber market in 2025, with disruption stemming primarily from international trade policy shifts rather than underlying crop supply limitations. Alberta Pulse Growers reported that China's implementation of a 100% tariff on Canadian peas in March 2025 led to an immediate decline of approximately CAD 1.25 per bushel in yellow pea bids, accelerating pricing pressure across upstream agricultural and downstream ingredient supply chains. Although lower feedstock costs may offer short-term margin advantages for pea ingredient manufacturers, elevated trade uncertainty continues to weaken visibility for long-term procurement strategies, capacity expansion planning, and capital allocation across the pea fiber market. The volatility also increases operational risk for processors with concentrated sourcing exposure, particularly those dependent on single-country procurement structures. In contrast, vertically integrated suppliers and companies with diversified sourcing networks, multi-regional supply agreements, and stronger inventory management capabilities are expected to demonstrate greater resilience and pricing flexibility under fluctuating trade conditions.
Other drivers and restraints analyzed in the detailed report include:
- Growing Consumer Preference for Clean-Label Ingredients
- Increasing Regulatory Support for Fiber-Enrichment Claims
- Increasing Competition from Alternative Fiber Ingredients
For complete list of drivers and restraints, kindly check the Table Of Contents.
Segment Analysis
Conventional pea fiber represented 86.4% of total market value in 2025, supported by the scale efficiencies and procurement advantages of well-established commodity-linked supply chains. Across the food and beverage sector, manufacturers continue to prioritize cost optimization and supply reliability over organic certification, particularly in high-volume applications such as bakery products and meat alternatives. In addition, strong yellow pea production bases in countries such as France and Germany continue to reinforce the cost competitiveness of conventional pea fiber grades within European food manufacturing. As a result, conventional formats remain the dominant volume driver across the pea fiber industry.
In contrast, organic pea fiber is projected to expand at a CAGR of 7.7% through 2031, positioning it as the faster-growing segment within the market. Roquette has demonstrated this transition through its certified organic pea ingredient portfolio sourced from Prairie farms and processed at its Portage la Prairie facility under NOP and equivalent certification standards. The strategy reflects a broader industry shift toward fully integrated organic supply chains rather than dependence on fragmented spot-certification models.
Geography Analysis
North America accounted for 36.9% of total market value in 2025, positioning it as the largest regional market within the pea fiber industry. The region benefits from a tightly integrated supply chain connecting Canadian yellow pea production with processing and food manufacturing demand across the United States and Canada. This structural advantage supports consistent raw material availability and strengthens supply reliability for processors serving the clean-label, gluten-free, and plant-based food sectors. Europe remained the second-largest regional market, supported by established processing ecosystems in Germany, France, Belgium, and Netherlands, where vertically integrated ingredient companies maintain long-term farmer partnerships, localized sourcing networks, and mature production infrastructure.
Asia-Pacific is projected to expand at a CAGR of 5.8% through 2031, making it the fastest-growing regional market for pea fiber. Growth is being driven by rising health awareness, increasing reformulation activity, and expanding demand for fiber-enriched foods across major consumer markets, particularly China.
South America remains comparatively underpenetrated despite Brazil's large-scale food processing sector and Argentina's strong agricultural export capabilities. Meanwhile, the Middle East and Africa presents longer-term growth potential, although limited domestic pea cultivation and continued dependence on imported ingredients constrain current market expansion. Across both regions, broader adoption will depend on improvements in ingredient distribution networks, localized formulation expertise, and end-user awareness.
- Roquette Freres
- Emsland Group
- Avena Foods Limited
- The Scoular Company
- COSUCRA Groupe Warcoing S.A.
- Ebro Foods, S.A.
- AGT Food and Ingredients Inc.
- Nutri-Pea Ltd.
- Foodchem International
- Fuji Oil Group
- Cefetra Group
- Nutra Food Ingredients
- CFF GmbH & Co. KG
- Baoji Oasier Nutri-tech Co., Ltd.
- J.Rettenmaier & Sohne GmbH + Co KG
- A&B Ingredients Inc.
- Vestkorn Milling AS
Additional Benefits:
- The market estimate (ME) sheet in Excel format
- 3 months of analyst support
TABLE OF CONTENTS
1 INTRODUCTION
- 1.1 Study Assumptions and Market Definition
- 1.2 Scope of the Study
2 RESEARCH METHODOLOGY
3 EXECUTIVE SUMMARY
4 MARKET LANDSCAPE
- 4.1 Market Overview
- 4.2 Market Drivers
- 4.2.1 Rising Adoption of Plant-Based and Vegan Diets
- 4.2.2 Growth in Gluten-Free Food Manufacturing
- 4.2.3 Increasing Regulatory Support for Fiber-Enrichment Claims
- 4.2.4 Growing Consumer Preference for Clean-Label Ingredients
- 4.2.5 Expansion of Production Capacity and Adoption of Dry-Fractionation Technologies
- 4.2.6 Increasing Health Consciousness and Dietary Awareness
- 4.3 Market Restraints
- 4.3.1 Volatility in Yellow Pea Prices and Supply Availability
- 4.3.2 Sensory and Texture Challenges at Higher Inclusion Levels
- 4.3.3 Increasing Competition from Alternative Fiber Ingredients
- 4.3.4 Limited Penetration Across Developing Markets
- 4.4 Supply-Chain Analysis
- 4.5 Regulatory Landscape
- 4.6 Porter's Five Forces Analysis
- 4.6.1 Bargaining Power of Buyers/Consumers
- 4.6.2 Bargaining Power of Suppliers
- 4.6.3 Threat of New Entrants
- 4.6.4 Threat of Substitute Products
- 4.6.5 Intensity of Competitive Rivalry
5 MARKET SIZE AND GROWTH FORECASTS (VALUE & VOLUME)
- 5.1 By Category
- 5.1.1 Conventional
- 5.1.2 Natural/Organic
- 5.2 By Application
- 5.2.1 Food and Beverages
- 5.2.1.1 Bakery and Confectionery
- 5.2.1.2 Meat and Meat Subtitutes
- 5.2.1.3 Snacks
- 5.2.1.4 Soups and Sauces
- 5.2.1.5 Beverages
- 5.2.1.6 Other Food and Beverages Application
- 5.2.2 Dietary Supplements
- 5.2.3 Pet Food and Animal Feed
- 5.2.4 Pharmaceuticals
- 5.2.5 Other Application
- 5.2.1 Food and Beverages
- 5.3 By Geography
- 5.3.1 North America
- 5.3.1.1 United States
- 5.3.1.2 Canada
- 5.3.1.3 Rest of North America
- 5.3.2 Europe
- 5.3.2.1 Germany
- 5.3.2.2 France
- 5.3.2.3 Spain
- 5.3.2.4 Netherlands
- 5.3.2.5 Rest of Europe
- 5.3.3 Asia-Pacific
- 5.3.3.1 China
- 5.3.3.2 India
- 5.3.3.3 Australia
- 5.3.3.4 Rest of Asia-Pacific
- 5.3.4 South America
- 5.3.4.1 Brazil
- 5.3.4.2 Rest of South America
- 5.3.5 Middle East and Africa
- 5.3.1 North America
6 COMPETITIVE LANDSCAPE
- 6.1 Market Concentration
- 6.2 Strategic Moves
- 6.3 Market Ranking Analysis
- 6.4 Company Profiles (includes Global level Overview, Market level overview, Core Segments, Financials as available, Strategic Information, Market Rank/Share for key companies, Products and Services, and Recent Developments)
- 6.4.1 Roquette Freres
- 6.4.2 Emsland Group
- 6.4.3 Avena Foods Limited
- 6.4.4 The Scoular Company
- 6.4.5 COSUCRA Groupe Warcoing S.A.
- 6.4.6 Ebro Foods, S.A.
- 6.4.7 AGT Food and Ingredients Inc.
- 6.4.8 Nutri-Pea Ltd.
- 6.4.9 Foodchem International
- 6.4.10 Fuji Oil Group
- 6.4.11 Cefetra Group
- 6.4.12 Nutra Food Ingredients
- 6.4.13 CFF GmbH & Co. KG
- 6.4.14 Baoji Oasier Nutri-tech Co., Ltd.
- 6.4.15 J.Rettenmaier & Sohne GmbH + Co KG
- 6.4.16 A&B Ingredients Inc.
- 6.4.17 Vestkorn Milling AS
7 MARKET OPPORTUNITIES AND FUTURE OUTLOOK

