
PUBLISHER: Mordor Intelligence | PRODUCT CODE: 2062320

PUBLISHER: Mordor Intelligence | PRODUCT CODE: 2062320
North America E-Commerce Warehouse - Market Share Analysis, Industry Trends & Statistics, Growth Forecasts (2026 - 2031)
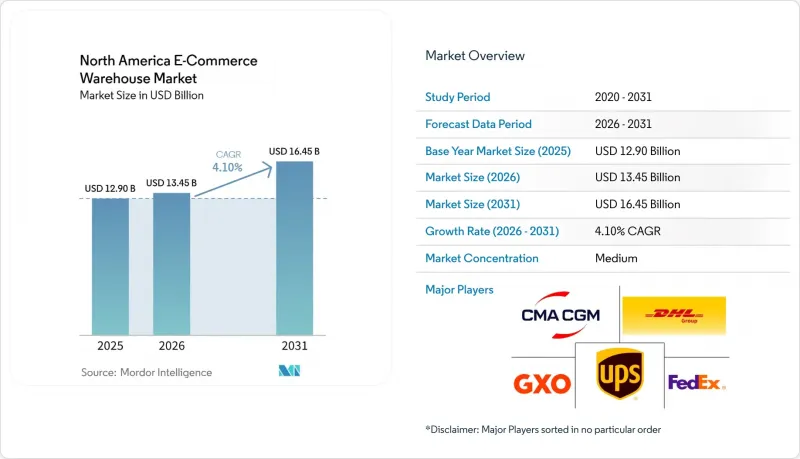
According to Mordor Intelligence, the north america e-commerce warehouse market size is projected to be USD 12.9 billion in 2025, USD 13.45 billion in 2026, and reach USD 16.45 billion by 2031, growing at a CAGR of 4.1% from 2026 to 2031.
The market's measured expansion masks a fundamental restructuring of warehouse economics as pallet-level B2B orders and high-velocity consumer shipments now compete for the same industrial footprints. This report is Segmented by Warehouse Type (Fulfillment Centers, Distribution Centers, Dark Stores and Micro-Fulfillment Centers, and More), by Service Type (Storage, Picking and Packing, and More), Automation Level (Manual, Semi-Automated, Automated), by End-User Industry (Apparel and Footwear, and More), and by Country. The Market Forecasts are Provided in Terms of Value (USD).
North America E-Commerce Warehouse Market Trends and Insights
B2B E-Commerce Surge Expanding Pallet-Level Storage Needs
Heightened B2B digital sales now require hybrid racking that supports full-pallet moves adjacent to pick-and-pack zones. United States B2B e-commerce exceeded USD 1.88 trillion in 2024, fueling demand for slotting systems that can be re-configured overnight through warehouse management algorithms. Some multi-tenant facilities already report 30-40% of daily volume in pallet orders, intensifying competition for ceiling height and dock doors. Flexible leases with quick change-over clauses are therefore outpacing long-term single-use contracts. The shift also attracts manufacturers bypassing wholesalers to sell directly online, which adds scheduling volatility that favors 24/7 operations.
Subscription and DTC Brand Growth Driving Kitting and Personalization Capacity
DTC sales exceeded USD 120 billion in 2025 and are trending toward smaller, more frequent boxes that must be personalized before shipping, raising labor minutes per order. Operators carve 20-30% of floor space into kitting cells equipped with QA stations and bespoke packaging, accepting denser headcounts in exchange for 40-50% higher revenue per square foot. Complex labeling obligations under United States Federal Trade Commission rules add to system requirements for traceability. Facilities that can scale work-cell counts rapidly during holiday spikes now win more RFPs from subscription platforms.
Escalating Warehouse-Insurance Premiums for Fire and Flood Risk
Commercial property premiums rose 8.4% nationwide in 2025, but spiked 25-40% in wildfire and flood zones, occasionally surpassing property-tax outlays. Fully automated sites see the sharpest uptick because robotics assets elevate insured values; some quotes exceed USD 15 per square foot each year versus USD 5-7 for conventional buildings. Operators now map FEMA floodplains and wildfire risk scorings as part of network design, trading slightly longer final-mile distances for lower carrying costs. Furthermore, insurers are becoming more discerning, scrutinizing both locations and building specifications. Consequently, developers and operators are contending with squeezed profit margins, a deceleration in expansion efforts, and diminished leeway in site selection, particularly in areas vulnerable to flooding or prone to fires.
Other drivers and restraints analyzed in the detailed report include:
- Free-Return Culture Escalating Reverse-Logistics Square Footage
- Oversized Imports Spurring High-Bay Warehouse Demand
- Construction-Material Supply Volatility Delaying New Builds
For complete list of drivers and restraints, kindly check the Table Of Contents.
Segment Analysis
Fulfillment centers accounted for 43.47% of the North America e-commerce warehouse market share in 2025, underpinned by regional demand for bulk storage and cross-docking. At the other end, dark stores and micro-fulfillment centers post a 9.34% CAGR to 2031 as retailers chase two-hour delivery promises in dense metros. The North America e-commerce warehouse market size for dark stores is projected to expand steadily as high-velocity SKUs justify higher rent profiles close to city cores. Distribution hubs still dominate inbound container deconsolidation, whereas cold-chain facilities accelerate alongside online grocery adoption.
Developers repurpose dormant big-box retail into urban dark stores, boosting pick rates by 40-50% compared with in-aisle shopping models. Yet zoning battles erupt as municipalities debate truck traffic and noise in former retail districts. High-bay construction within city limits remains rare due to height caps, encouraging mezzanine builds that stretch cubic capacity without breaching roof-height codes. Proximity's value shields operators from the rate cuts now visible at suburban sheds, underscoring bifurcated demand inside the North America e-commerce warehouse market.
Storage retained 46.15% of the North America e-commerce warehouse market size in 2025, but value-added services are on an 8.81% CAGR path that outpaces any other category through 2031. North America e-commerce warehouse market advantages accrue to 3PLs able to integrate kitting, light assembly, gift wrapping, and stringent QC routines under one roof. Revenue per pallet climbs as operators bill labor in fifteen-minute increments, frequently doubling gross margins relative to racked storage alone.
DTC brands resort to these services because in-house fulfillment would delay launch cycles. Operators now allocate work cells next to high-velocity inventory lanes, minimizing travel and lifting daily order-processing efficiency. However, these zones carry turnover rates up to 30% due to repetitive fine-motor tasks, so market participants deploy gamified dashboards and stepped wage ladders to retain staff. Flexible labor platforms also emerge, supplying pre-vetted gig workers during holiday peaks.
List of Companies Covered in this Report:
- DHL Group
- GXO Logistics
- FedEx
- United Parcel Service of America, Inc. (UPS)
- XPO, Inc.
- GEODIS
- C.H. Robinson
- Kenco Logistics
- Ryder System, Inc.
- Lineage, Inc.
- Americold
- NFI Industries
- Omni Logistics
- Penske Corporation
- Stord
- ShipNetwork
- Red Stag Fulfillment
- Buske Logistics
- CMA CGM Group (Including CEVA Logistics)
- DSV A/S
Additional Benefits:
- The market estimate (ME) sheet in Excel format
- 3 months of analyst support
TABLE OF CONTENTS
1 Introduction
- 1.1 Study Assumptions and Market Definition
- 1.2 Scope of the Study
2 Research Methodology
3 Executive Summary
4 Market Landscape
- 4.1 Market Overview
- 4.2 Market Drivers
- 4.2.1 B2B E-Commerce Surge Expanding Pallet-Level Storage Needs
- 4.2.2 Subscription and DTC Brand Growth Driving Kitting and Personalization Capacity
- 4.2.3 Free-Return Culture Escalating Reverse-Logistics Square Footage
- 4.2.4 Oversized Imports (Furniture, Fitness) Spurring High-Bay Warehouse Demand
- 4.2.5 Carbon-Credit Funded "Green Warehouse" Projects Unlocking Capex
- 4.2.6 Rooftop Drone-Hub Integration Along FAA Delivery Corridors
- 4.3 Market Restraints
- 4.3.1 Escalating Warehouse-Insurance Premiums for Fire and Flood Risk
- 4.3.2 Construction-Material Supply Volatility Delaying New Builds
- 4.3.3 IoT Data-Privacy Regulations Complicating Sensor Deployment
- 4.3.4 Shortage of Robotics-Maintenance Technicians Elevating Downtime Risk
- 4.4 Value / Supply-Chain Analysis
- 4.5 Regulatory Landscape
- 4.6 Technological Outlook
- 4.7 Porter's Five Forces Analysis
- 4.7.1 Threat of New Entrants
- 4.7.2 Bargaining Power of Buyers
- 4.7.3 Bargaining Power of Suppliers
- 4.7.4 Threat of Substitutes
- 4.7.5 Competitive Rivalry
5 Market Size and Growth Forecasts (Value, USD)
- 5.1 By Warehouse Type
- 5.1.1 Fulfilment Centers
- 5.1.2 Distribution Centers (DCs)
- 5.1.3 Cold-Chain Warehouses
- 5.1.4 Dark Stores / Micro-Fulfillment Centers
- 5.1.5 Others (Reverse Logistics Hubs, Bonded Warehouses, Hybrid-use Spaces, etc.)
- 5.2 By Service Type
- 5.2.1 Storage
- 5.2.2 Picking and Packing
- 5.2.3 Value-Added Services and Others (Kitting, Labelling)
- 5.3 By Automation Level
- 5.3.1 Manual
- 5.3.2 Semi-Automated
- 5.3.3 Fully Automated
- 5.4 By End-User Industry
- 5.4.1 Apparel and Footwear
- 5.4.2 Consumer Electronics
- 5.4.3 Grocery and FMCG
- 5.4.4 Pharmaceuticals, Beauty and Wellness
- 5.4.5 Home Essentials and Furnishings
- 5.4.6 Others
- 5.5 By Country
- 5.5.1 United States
- 5.5.2 Canada
- 5.5.3 Mexico
6 Competitive Landscape
- 6.1 Market Concentration
- 6.2 Strategic Moves
- 6.3 Market Share Analysis
- 6.4 Company Profiles (Includes Global Level Overview, Market Level Overview, Core Segments, Financials as Available, Strategic Information, Market Rank/Share, Products and Services, Recent Developments)
- 6.4.1 DHL Group
- 6.4.2 GXO Logistics
- 6.4.3 FedEx
- 6.4.4 United Parcel Service of America, Inc. (UPS)
- 6.4.5 XPO, Inc.
- 6.4.6 GEODIS
- 6.4.7 C.H. Robinson
- 6.4.8 Kenco Logistics
- 6.4.9 Ryder System, Inc.
- 6.4.10 Lineage, Inc.
- 6.4.11 Americold
- 6.4.12 NFI Industries
- 6.4.13 Omni Logistics
- 6.4.14 Penske Corporation
- 6.4.15 Stord
- 6.4.16 ShipNetwork
- 6.4.17 Red Stag Fulfillment
- 6.4.18 Buske Logistics
- 6.4.19 CMA CGM Group (Including CEVA Logistics)
- 6.4.20 DSV A/S
7 Market Opportunities and Future Outlook

