
PUBLISHER: Mordor Intelligence | PRODUCT CODE: 2062468

PUBLISHER: Mordor Intelligence | PRODUCT CODE: 2062468
Organic Biogas - Market Share Analysis, Industry Trends & Statistics, Growth Forecasts (2026 - 2031)
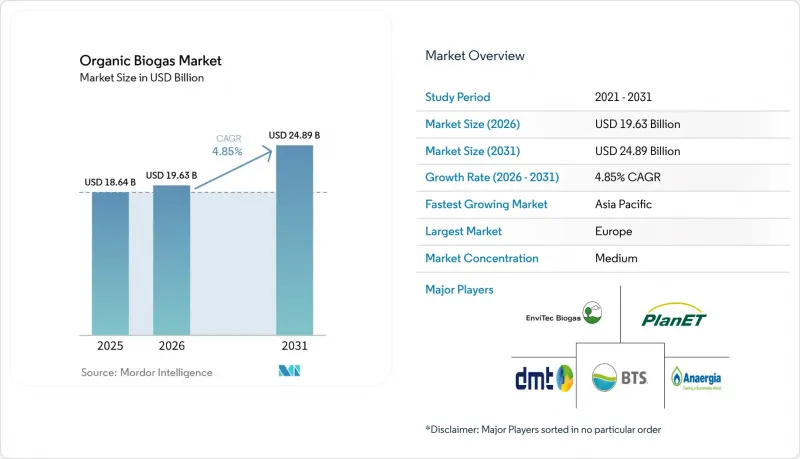
According to Mordor Intelligence, the organic biogas market size is projected to be USD 18.64 billion in 2025, USD 19.63 billion in 2026, and reach USD 24.89 billion by 2031, growing at a CAGR of 4.85% from 2026 to 2031.
This report is Segmented by Feedstock (Agricultural Residues, and More), Technology (Wet Anaerobic Digestion, and More), Plant Scale (Farm-Scale, Medium, and More), Application (Electricity Generation and More), End-User Sector (Municipal Utilities, and More), and Geography (North America, Europe, Asia-Pacific, South America, Middle East and Africa). Market Forecasts are Provided in Terms of Value (USD).
Global Organic Biogas Market Trends and Insights
Government Incentives & Renewable-Energy Targets
Investment-grade policy clarity underpins the organic biogas market. The US RNG Incentive Act anchors production tax credits that insulate developers from wholesale power volatility. Brazil's 2025 biomethane statute obliges gas suppliers to cut emissions 10% from 2026, immediately sharpening purchase obligations for low-carbon molecules. Denmark's 70% emission-reduction law executes a biomethane-first grid strategy that absorbs nearly all domestic feedstock potential. India's SATAT scheme provides offtake guarantees that scale domestic bio-CNG plants, fostering a forty-fold demand rise by FY 2030.Such aligned measures give financiers confidence to back multimegawatt facilities with 15-year paybacks.
Rising Organic-Waste Generation & Landfill-Diversion Mandates
Municipal tipping-fee escalation and methane-abatement goals propel organic biogas market growth in cities. Advanced digesters now remove 95% biochemical oxygen demand from food waste while yielding 0.292 L methane per gram of chemical oxygen demand removed.Anaerobic membrane bioreactors co-located at wastewater plants treat high-strength organics and generate grid-quality biomethane streams. Typical metropolitan projects repay capital within six years once digestate fertilizer and carbon credits are monetized. Urban feedstock consistency enables larger facilities, lowering unit costs and boosting profitability relative to seasonally constrained farm residues.
High Upfront CAPEX of Anaerobic-Digestion Plants
Utility-scale digesters cost USD 3-8 million per MW, reflecting bespoke preprocessing, biogas upgrading, and odor management systems. EnviTec's EUR 50 million upgrades at Forst and Friedland double gas-upgrading capacity yet illustrate steep capital hurdles even for experienced operators. Although lenders cite technology risk, asset-class maturity, and 95% uptime records increasingly secure project finance in developed markets, while emerging regions still face constrained debt availability.
Other drivers and restraints analyzed in the detailed report include:
- Decarbonization Mandates for Transportation Bio-Fuels
- Carbon-Negative Bio-Fertilizer Demand
- Grid-Injection Bottlenecks & Gas-Quality Compliance Costs
For complete list of drivers and restraints, kindly check the Table Of Contents.
Segment Analysis
Agricultural residues retained 34.1% of the organic biogas market share in 2025. In contrast, food waste meets municipal diversion mandates and is expanding at 6.7% annually, delivering reliable gate fees that improve project IRRs.
Municipal curbside programs are diverting 18 million tons of food waste per year within the EU alone, funneling high-energy substrates into digesters that realize 520 Nm3 of biogas per ton, roughly 45% more than average crop residues. California's dairy sector illustrates parallel momentum: 12.3 million tons of manure fed to digesters in 2024 generated RNG credits worth USD 620 million, surpassing farm milk revenue for herds under 800 cows. The sewage sludge market is expected to decline after Germany bans land application from large plants in 2029.
Wet CSTR continues to dominate with 52.3% share because of operational reliability and legacy investments, yet dry digestion is growing 7.1% per year by leveraging 70% lower water use and 40% smaller footprint. A DRANCO high-solids plant can reduce retention time to 21 days, boosting throughput without proportional capex.
Two-stage co-digestion designs boost methane yields from lipid-rich waste. However, this comes at an added cost of USD 1.2 million for a 1 MW setup. While Laguna-type systems are favored in tropical livestock hubs for their cost-effectiveness, they face scrutiny due to an average methane slip, jeopardizing their climate credentials. In 2025, the introduction of active-suction membrane covers reduced this slip. Yet, in markets where credit is hard to come by, this innovation has pushed the payback period out by over a year.
Geography Analysis
Europe maintained 41.2% of 2025 revenue, anchored by Germany's 9,500 plants and Denmark's world-leading 28% biomethane grid penetration. Feedstock sources mature, and interconnection queues stretch to 18 months in regions such as Bavaria. Nordic countries are experiencing growth, driven by a 30% renewable transport fuel mandate and the early adoption of bio-LNG.
Asia-Pacific will expand 6.4% annually through 2031, making it the fastest-growing region in the organic biogas market. China's CNY 50 billion rural-digester fund and India's 5,000-plant SATAT target underpin momentum, though execution lags amid land fears and offtake-price disputes. Japan is emerging as a niche leader post-2024 Food Recycling Law amendments, and Southeast Asian growth is backed by palm-effluent lagoon projects.
In North America, California drives RNG demand via LCFS, while Canada's provincial carbon taxes have triggered a dozen new projects in British Columbia and Quebec. Mexico adds capacity mainly for on-site steam in food factories because of limited pipeline access. South America and the Middle East & Africa remain small but are logging pilot projects in Brazil's sugar sector and the UAE's waste-to-energy build-out.
- EnviTec Biogas AG
- PlanET Biogas Group
- BTS Biogas SRL
- BioConstruct GmbH
- Scandinavian Biogas
- Nature Energy Biogas
- Bright Biomethane
- Anaergia Inc.
- Hitachi Zosen Inova
- Future Biogas
- Gasum Oy
- Agraferm GmbH
- DMT Environmental Technology
- Schmack Biogas GmbH
- Veolia Environnement
- Air Liquide Biogas Solutions
- ENGIE Biomethane
- Clean Energy Fuels Corp.
- Wartsila (Puregas Solutions)
- Gazpack BV
Additional Benefits:
- The market estimate (ME) sheet in Excel format
- 3 months of analyst support
TABLE OF CONTENTS
1 Introduction
- 1.1 Study Assumptions & Market Definition
- 1.2 Scope of the Study
2 Research Methodology
3 Executive Summary
4 Market Landscape
- 4.1 Market Overview
- 4.2 Market Drivers
- 4.2.1 Government incentives & renewable-energy targets
- 4.2.2 Rising organic-waste generation & landfill-diversion mandates
- 4.2.3 Decarbonisation mandates for transportation bio-fuels (RNG / Bio-CNG)
- 4.2.4 Carbon-negative bio-fertiliser demand (digestate valorisation)
- 4.2.5 Corporate RNG procurement via virtual pipelines & certificates
- 4.2.6 Bio-LNG demand for emerging green maritime corridors
- 4.3 Market Restraints
- 4.3.1 High upfront CAPEX of anaerobic-digestion plants
- 4.3.2 Feedstock supply-chain seasonality & logistics complexity
- 4.3.3 Grid-injection bottlenecks & gas-quality compliance costs
- 4.3.4 Local opposition due to odour / heavy-vehicle traffic (NIMBY)
- 4.4 Supply-Chain Analysis
- 4.5 Regulatory Landscape
- 4.6 Technological Outlook
- 4.7 Porters Five Forces
- 4.7.1 Threat of New Entrants
- 4.7.2 Bargaining Power of Suppliers
- 4.7.3 Bargaining Power of Buyers
- 4.7.4 Threat of Substitutes
- 4.7.5 Competitive Rivalry
5 Market Size & Growth Forecasts
- 5.1 By Feedstock
- 5.1.1 Agricultural Residues
- 5.1.2 Animal Manure
- 5.1.3 Food and Kitchen Waste
- 5.1.4 Sewage Sludge
- 5.1.5 Industrial Organic Waste
- 5.1.6 Energy Crops (e.g., maize silage, sorghum)
- 5.2 By Technology
- 5.2.1 Wet Anaerobic Digestion (CSTR)
- 5.2.2 Dry/High-Solids Digestion
- 5.2.3 Two-Stage/Co-digestion Systems
- 5.2.4 Lagoon/Covered-lagoon AD
- 5.3 By Plant Scale
- 5.3.1 Farm-scale (Below 250 kW)
- 5.3.2 Medium (250 kW to1 MW)
- 5.3.3 Utility-scale (Above 1 MW)
- 5.4 By Application
- 5.4.1 Electricity Generation
- 5.4.2 Heat Only
- 5.4.3 Combined Heat and Power (CHP)
- 5.4.4 Vehicle Fuel (Bio-CNG/Bio-LNG)
- 5.4.5 Pipeline RNG Injection
- 5.4.6 Industrial Steam / Process Heat
- 5.5 By End-User Sector
- 5.5.1 Municipal Utilities
- 5.5.2 Agriculture and Livestock Farms
- 5.5.3 Food and Beverage Manufacturers
- 5.5.4 Waste-management Companies
- 5.5.5 Transport Fuel Distributors
- 5.5.6 Others
- 5.6 By Geography
- 5.6.1 North America
- 5.6.1.1 United States
- 5.6.1.2 Canada
- 5.6.1.3 Mexico
- 5.6.2 Europe
- 5.6.2.1 United Kingdom
- 5.6.2.2 Germany
- 5.6.2.3 France
- 5.6.2.4 Spain
- 5.6.2.5 Nordic Countries
- 5.6.2.6 Russia
- 5.6.2.7 Rest of Europe
- 5.6.3 Asia-Pacific
- 5.6.3.1 China
- 5.6.3.2 India
- 5.6.3.3 Japan
- 5.6.3.4 South Korea
- 5.6.3.5 ASEAN Countries
- 5.6.3.6 Australia and New Zealand
- 5.6.3.7 Rest of Asia-Pacific
- 5.6.4 South America
- 5.6.4.1 Brazil
- 5.6.4.2 Argentina
- 5.6.4.3 Colombia
- 5.6.4.4 Rest of South America
- 5.6.5 Middle East and Africa
- 5.6.5.1 United Arab Emirates
- 5.6.5.2 Saudi Arabia
- 5.6.5.3 South Africa
- 5.6.5.4 Egypt
- 5.6.5.5 Rest of Middle East and Africa
- 5.6.1 North America
6 Competitive Landscape
- 6.1 Market Concentration
- 6.2 Strategic Moves (M&A, Partnerships, PPAs)
- 6.3 Market Share Analysis (Market Rank/Share for key companies)
- 6.4 Company Profiles (includes Global level Overview, Market level overview, Core Segments, Financials as available, Strategic Information, Products & Services, and Recent Developments)
- 6.4.1 EnviTec Biogas AG
- 6.4.2 PlanET Biogas Group
- 6.4.3 BTS Biogas SRL
- 6.4.4 BioConstruct GmbH
- 6.4.5 Scandinavian Biogas
- 6.4.6 Nature Energy Biogas
- 6.4.7 Bright Biomethane
- 6.4.8 Anaergia Inc.
- 6.4.9 Hitachi Zosen Inova
- 6.4.10 Future Biogas
- 6.4.11 Gasum Oy
- 6.4.12 Agraferm GmbH
- 6.4.13 DMT Environmental Technology
- 6.4.14 Schmack Biogas GmbH
- 6.4.15 Veolia Environnement
- 6.4.16 Air Liquide Biogas Solutions
- 6.4.17 ENGIE Biomethane
- 6.4.18 Clean Energy Fuels Corp.
- 6.4.19 Wartsila (Puregas Solutions)
- 6.4.20 Gazpack BV
7 Market Opportunities & Future Outlook
- 7.1 White-space & Unmet-need Assessment
- 7.2 Emerging Financing Models (green bonds, blended finance)
- 7.3 Circular-economy Integration Opportunities
- 7.4 Digestate-based Biofertiliser Commercialisation
- 7.5 Pathways to Negative-emission Credits

