
PUBLISHER: Mordor Intelligence | PRODUCT CODE: 2063247

PUBLISHER: Mordor Intelligence | PRODUCT CODE: 2063247
Solar Cell - Market Share Analysis, Industry Trends & Statistics, Growth Forecasts (2026 - 2031)
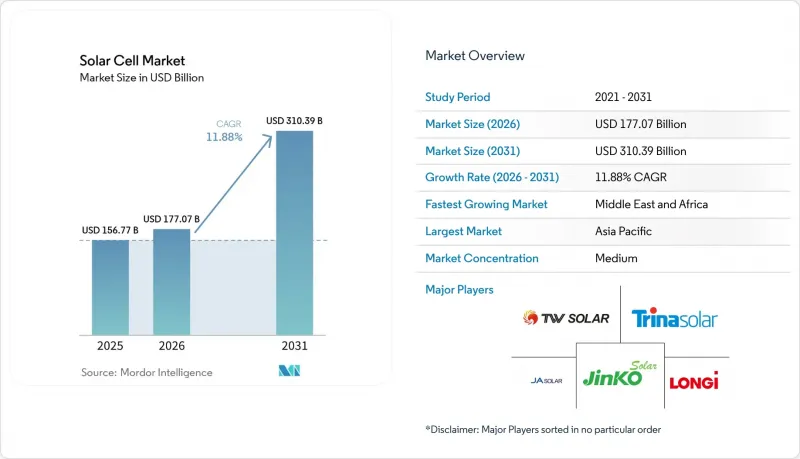
According to Mordor Intelligence, the solar cell market size is projected to be USD 156.77 billion in 2025, USD 177.07 billion in 2026, and reach USD 310.39 billion by 2031, growing at a CAGR of 11.88% from 2026 to 2031.
This report is Segmented by Type (Crystalline-Silicon, Others), Cell Technology (P-Type PERC, N-Type TOPCon, HJT, IBC, BC, Tandem), Application (Residential, Commercial, Industrial, Utility, Floating PV, Consumer Electronics, Automotive, Aerospace, Others), and Geography (North America, Europe, Asia-Pacific, South America, Middle East and Africa). The Market Forecasts are Provided in Terms of Value (USD).
Global Solar Cell Market Trends and Insights
Declining Levelized Cost of Electricity (LCOE)
Utility solar reached a global average LCOE of USD 0.043 kWh in 2024, with China at USD 0.033 kWh, undercutting new coal and gas in 90% of tracked markets. Record-low tariffs of USD 0.026 kWh were achieved for 3.9 GW of Indian capacity in 2024 auctions, signaling a structural reset for thermal peaker plants. In Brazil, 2024 procurements cleared at USD 24 MWh, proving Latin American grids also view solar as the least-cost supply. U.S. projects still average USD 0.070 kWh, yet the gap is narrowing as module prices fall and tracker algorithms boost specific yield. Solar-plus-storage hybrids now capture ancillary-service income once reserved for combustion turbines, redefining capacity-market economics in ERCOT and CAISO.
Global Decarbonization Targets and Incentives
The U.S. Inflation Reduction Act's Section 45X credits triggered 15 GW of new domestic capacity announcements, lifting First Solar's roadmap to 25 GW by 2026. Europe's Carbon Border Adjustment Mechanism raises the landed cost of high-carbon imports by USD 0.02-0.04 W, redirecting procurement toward regional lines. China's 14th Five-Year Plan locks in 1,200 GW of wind and solar by 2030, while India's USD 2.4 billion PLI incentives push cell makers onto the government's Approved List of Models and Manufacturers. Sovereign AI-datacenter mandates in the Gulf add premium demand for bifacial and low-degradation modules, illustrating the policy's widening scope beyond power markets.
Oversupply-Driven Module Price Crash
China's polysilicon output rose to 2.77 million tonnes in 2025, versus global demand of 1.8 million tonnes, causing spot silicon prices 60% to USD 12 kg. Module prices followed, touching USD 0.10-0.12 W and pushing eight gigawatts of tier-2 capacity offline. Vertically integrated giants preserve 8-10% EBITDA by internalizing value capture, whereas pure-play assemblers see cash-flow stress and potential forced consolidation. The downturn is paradoxically accelerating technology upgrades, as firms invest in TOPCon and HJT to escape commoditization even while margins remain thin.
Other drivers and restraints analyzed in the detailed report include:
- Corporate Clean-Energy PPAs Boom
- Commercialization of N-Type TOPCon & HJT Cells
- Grid-Connection Bottlenecks
For complete list of drivers and restraints, kindly check the Table Of Contents.
Segment Analysis
Crystalline-silicon designs controlled 84.6% of the solar cell market in 2025, with monocrystalline variants delivering 24-25% efficiencies and falling wafer costs. Niche avenues such as CIGS and amorphous silicon now target BIPV or lightweight electronics where flexibility overshadows efficiency sacrifice.
Emerging solar technologies include perovskite, organic photovoltaic (OPV), quantum-dot, and dye-sensitized solar cells (DSSC). Crystalline silicon will dominate utility-scale and rooftop installations through 2031, while perovskite tandems target premium segments like space-constrained commercial and BIPV applications. IEC 61215 certification for perovskite modules is expected by 2027, enabling project financing. OPVs remain limited to ultra-low-power uses, quantum-dot cells are in development, and DSSCs face competition from higher-performing perovskites. IEC 61215 certification drafts for perovskite modules are in process, and approval could unlock larger project-finance pools post-2027. In the interim, rooftop and architectural-glass applications allow early movers to recoup higher price points despite field-reliability unknowns.
Geography Analysis
Asia-Pacific retained 64.3% revenue share in 2025 as China ramped polysilicon and module lines exceeding 400 GW of combined capacity. India's USD 2.4 billion PLI subsidies and ALMM rules rerouted 12 GW of annual orders to domestic suppliers, while Japan and South Korea leveraged technology leadership to serve ASEAN imports. Vietnam and Malaysia expanded output to 5 GW each, using trade-neutral positioning to reach U.S. and EU buyers. The solar cell market size across Asia-Pacific is projected to reach USD 210 billion by 2031.
The Middle East and Africa post the fastest growth at 23.2% CAGR, anchored by Saudi Arabia's 2.6 GW NEOM allocation and the UAE's march to 5 GW at its Mohammed bin Rashid park by 2030. Egypt's Benban complex and South Africa's REIPPPP illustrate how multilateral finance de-risks sovereign credit, unlocking scale projects that reshape regional load curves. Grid-integrated desalination and green hydrogen drive additional off-take, supporting a widening solar cell market in water-stressed states.
The U.S. IRA's 45X credit supports a domestic CdTe cluster exceeding 11 GW, while the EU's Net-Zero Industry Act funds 30 GW of reshored capacity. Canadian provinces align with federal tax credits to phase out coal, and Brazil's auctions clear at world-class low tariffs, signaling new poles of utility-scale buildout. The U.S. Inflation Reduction Act's 45X credit drives First Solar's 25 GW capacity target by 2026, with 6 GW added in Ohio and Alabama. The EU's 2024 Net-Zero Industry Act allocates EUR 3 billion to reshore 30 GW by 2030, aiding Meyer Burger and Enel. Canada's 5 GW solar pipeline replaces coal, while Brazil and Argentina expand solar capacity, exporting electricity to Chile via cross-border interconnections.
- LONGi Green Energy Technology Co., Ltd.
- Tongwei Solar Co., Ltd.
- JA Solar Technology Co., Ltd.
- Trina Solar Co., Ltd.
- JinkoSolar Holding Co., Ltd.
- First Solar, Inc.
- Canadian Solar Inc.
- Hanwha Q CELLS Co., Ltd.
- Risen Energy Co., Ltd.
- SunPower Corporation
- Maxeon Solar Technologies
- REC Group
- Yingli Green Energy Holding Co. Ltd.
- Panasonic Holdings Corporation
- Sharp Corporation
- Aiko Solar (Jiangxi) Co., Ltd.
- Runergy (Jiangsu) Co., Ltd.
- Astronergy (Chint)
- Huasun Energy Co., Ltd.
- Meyer Burger Technology AG
- Oxford PV Ltd.
- Heliatek GmbH
- Solaria Corporation
- Suntech Power Co., Ltd.
- Emeren Group Ltd.
Additional Benefits:
- The market estimate (ME) sheet in Excel format
- 3 months of analyst support
TABLE OF CONTENTS
1 Introduction
- 1.1 Study Assumptions & Market Definition
- 1.2 Scope of the Study
2 Research Methodology
3 Executive Summary
4 Market Landscape
- 4.1 Market Overview
- 4.2 Market Drivers
- 4.2.1 Declining levelised cost of electricity (LCOE)
- 4.2.2 Global decarbonisation targets & incentives
- 4.2.3 Corporate clean-energy PPAs boom
- 4.2.4 Commercialisation of n-type TOPCon & HJT cells
- 4.2.5 Perovskite-silicon tandem pilot lines (2026+)
- 4.2.6 Grid-forming-inverter mandates favouring high-efficiency cells
- 4.3 Market Restraints
- 4.3.1 Oversupply-driven module price crash
- 4.3.2 Grid-connection bottlenecks
- 4.3.3 Looming silver & indium supply constraints
- 4.3.4 Trade-barrier uncertainty (AD/CVD, CBAM)
- 4.4 Supply-Chain Analysis
- 4.5 Raw-Material (Polysilicon, Silver, Glass) Analysis
- 4.6 Regulatory Landscape
- 4.7 Technological Outlook
- 4.8 Porter's Five Forces Analysis
- 4.8.1 Threat of New Entrants
- 4.8.2 Bargaining Power of Buyers
- 4.8.3 Bargaining Power of Suppliers
- 4.8.4 Threat of Substitutes
- 4.8.5 Competitive Rivalry
5 Market Size & Growth Forecasts
- 5.1 By Type
- 5.1.1 Crystalline-Silicon Solar Cells
- 5.1.1.1 Monocrystalline Silicon
- 5.1.1.2 Polycrystalline Silicon
- 5.1.2 Thin-Film Solar Cells
- 5.1.2.1 Cadmium Telluride (CdTe)
- 5.1.2.2 Amorphous Silicon (a-Si)
- 5.1.2.3 Copper Indium Gallium Selenide (CIGS)
- 5.1.3 Emerging Technologies
- 5.1.3.1 Perovskite Solar Cells
- 5.1.3.2 Organic Photovoltaic (OPV) Cells
- 5.1.3.3 Quantum-Dot Solar Cells
- 5.1.3.4 Dye-Sensitised Solar Cells (DSSC)
- 5.1.1 Crystalline-Silicon Solar Cells
- 5.2 By Cell Technology
- 5.2.1 P-type PERC
- 5.2.2 n-type TOPCon
- 5.2.3 Heterojunction (HJT)
- 5.2.4 Interdigitated Back-Contact (IBC)
- 5.2.5 Back-Contact (BC)
- 5.2.6 Tandem (Perovskite-Si, III-V)
- 5.3 By Application
- 5.3.1 Residential - Rooftop
- 5.3.2 Commercial
- 5.3.3 Industrial
- 5.3.4 Ground-Mounted Utility
- 5.3.5 Floating PV
- 5.3.6 Consumer Electronics
- 5.3.7 Automotive and Transportation
- 5.3.8 Aerospace and Defense
- 5.3.9 Others (Agrivoltaic, Wearables, Off-grid, etc.)
- 5.4 By Geography
- 5.4.1 North America
- 5.4.1.1 United States
- 5.4.1.2 Canada
- 5.4.1.3 Mexico
- 5.4.2 Europe
- 5.4.2.1 Germany
- 5.4.2.2 United Kingdom
- 5.4.2.3 France
- 5.4.2.4 Italy
- 5.4.2.5 NORDIC Countries
- 5.4.2.6 Russia
- 5.4.2.7 Rest of Europe
- 5.4.3 Asia-Pacific
- 5.4.3.1 China
- 5.4.3.2 India
- 5.4.3.3 Japan
- 5.4.3.4 South Korea
- 5.4.3.5 ASEAN Countries
- 5.4.3.6 Rest of Asia-Pacific
- 5.4.4 South America
- 5.4.4.1 Brazil
- 5.4.4.2 Argentina
- 5.4.4.3 Rest of South America
- 5.4.5 Middle East and Africa
- 5.4.5.1 Saudi Arabia
- 5.4.5.2 United Arab Emirates
- 5.4.5.3 South Africa
- 5.4.5.4 Egypt
- 5.4.5.5 Rest of Middle East and Africa
- 5.4.1 North America
6 Competitive Landscape
- 6.1 Market Concentration
- 6.2 Strategic Moves (M&A, Partnerships, PPAs)
- 6.3 Market Share Analysis (Market Rank/Share for key companies)
- 6.4 Company Profiles (includes Global level Overview, Market level overview, Core Segments, Financials as available, Strategic Information, Products & Services, and Recent Developments)
- 6.4.1 LONGi Green Energy Technology Co., Ltd.
- 6.4.2 Tongwei Solar Co., Ltd.
- 6.4.3 JA Solar Technology Co., Ltd.
- 6.4.4 Trina Solar Co., Ltd.
- 6.4.5 JinkoSolar Holding Co., Ltd.
- 6.4.6 First Solar, Inc.
- 6.4.7 Canadian Solar Inc.
- 6.4.8 Hanwha Q CELLS Co., Ltd.
- 6.4.9 Risen Energy Co., Ltd.
- 6.4.10 SunPower Corporation
- 6.4.11 Maxeon Solar Technologies
- 6.4.12 REC Group
- 6.4.13 Yingli Green Energy Holding Co. Ltd.
- 6.4.14 Panasonic Holdings Corporation
- 6.4.15 Sharp Corporation
- 6.4.16 Aiko Solar (Jiangxi) Co., Ltd.
- 6.4.17 Runergy (Jiangsu) Co., Ltd.
- 6.4.18 Astronergy (Chint)
- 6.4.19 Huasun Energy Co., Ltd.
- 6.4.20 Meyer Burger Technology AG
- 6.4.21 Oxford PV Ltd.
- 6.4.22 Heliatek GmbH
- 6.4.23 Solaria Corporation
- 6.4.24 Suntech Power Co., Ltd.
- 6.4.25 Emeren Group Ltd.
7 Market Opportunities & Future Outlook
- 7.1 White-space & Unmet-Need Assessment

