
PUBLISHER: Mordor Intelligence | PRODUCT CODE: 2063431

PUBLISHER: Mordor Intelligence | PRODUCT CODE: 2063431
Agent-Oriented Enterprise Architecture - Market Share Analysis, Industry Trends & Statistics, Growth Forecasts (2026 - 2031)
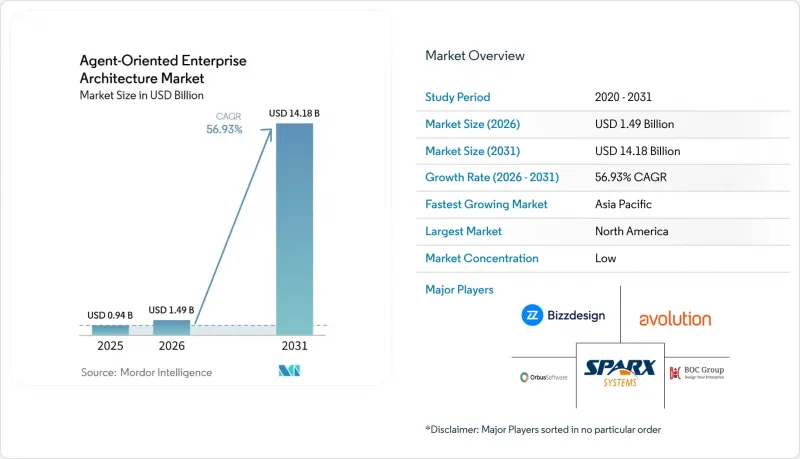
According to Mordor Intelligence, the agent-oriented enterprise architecture market size is expected to grow from USD 0.94 billion in 2025 to USD 1.49 billion in 2026 and is forecast to reach USD 14.18 billion by 2031 at 56.93% CAGR over 2026-2031.
This report is Segmented by Product Type (Modeling Tools, Integrated Development Environments, Agent-Based Simulation Platforms, and More), Deployment Mode (On-Premises, Cloud, and Hybrid), Enterprise Size (Large Enterprises, Small and Medium Enterprises), End-User Industry (BFSI, Government and Defense, and More), and Geography. The Market Forecasts are Provided in Terms of Value (USD).
Global Agent-Oriented Enterprise Architecture Market Trends and Insights
Accelerating Adoption of Autonomous Business Processes
Enterprises now embed agents that execute end-to-end workflows such as compliance validation, scheduling, and cross-system updates without human initiation, which lowers coordination friction and improves cycle times. A global bank shortened loan processing by integrating agentic orchestration across underwriting and customer-relationship platforms, realizing gains by eliminating manual handoffs rather than workforce cuts. Agents differ from robotic process automation because they plan multi-step actions, self-correct when exceptions arise, and escalate only when confidence falls below policy thresholds. Gulf financial institutions deploy multi-agent orchestration for anti-money-laundering, reducing false positives while retaining human review for high-risk alerts. The resulting productivity gains are pushing boards to formalize AI operating models that define which decisions agents can execute autonomously.
Shift Toward Composable Agent-Based Digital Platforms
Chief information officers consolidate investments around integrated superplatforms that merge applications, data foundations, orchestration layers, and cloud infrastructure for scalable, governed agent deployment. Integrated control planes offering deterministic policy enforcement, audit trails, and cost governance now represent a key differentiator. Enterprises running on unified platforms report 20-30% faster AI outcomes due to reduced integration friction. SAP and Amazon Web Services launched an AI Co-Innovation Program that enables partners to build domain agents for supply-chain optimization and anomaly detection. Accenture delivers resiliency agents for utilities while Deloitte builds finance agents for healthcare on the same stack.
Shortage of Agent-Oriented Design Skill Sets
Enterprises struggle to find architects fluent in multi-agent systems, communication protocols, and AI governance, which slows deployment and increases reliance on vendors. ISO 42001 and new job roles, such as Enterprise Agent Architect, require skills not taught in traditional curricula. Emerging markets face brain drain and limited training pipelines, intensifying competition for talent. Vendors answer with low-code tools like SAP Journey Studio, but architectural judgment on escalation policies and risk alignment still requires expert input. Without rapid upskilling, project timelines extend, and governance gaps widen.
Other drivers and restraints analyzed in the detailed report include:
- Surge in Edge-to-Cloud Workload Orchestration Demands
- Rapid Uptake of Digital Twin-Driven Enterprise Modeling
- Fragmentation of Interoperability Standards
For complete list of drivers and restraints, kindly check the Table Of Contents.
Segment Analysis
Simulation platforms are the fastest-growing category, expanding at a 57.93% CAGR as organizations stress-test multi-agent behavior before production deployment, while modeling tools retained 42.57% of the agent-oriented enterprise architecture market share in 2025. The agent-oriented enterprise architecture market size for simulation platforms is projected to outpace other product types, driven by firms that must validate decision logic against adversarial scenarios. Integrated development environments now ship with pro-code studios and notebooks that connect to LangGraph and CrewAI, allowing developers to configure tool usage and memory scopes. Middleware abstracts REST and GraphQL endpoints, so agents can tap enterprise resource planning and customer relationship management systems without embedded credentials.
A second growth vector is the conversion of traditional diagrams into structured repositories. SAP LeanIX uses computer vision to parse images and populate inventory with applications, data objects, and their dependencies, enabling rapid impact analysis. Ardoq's Model Context Protocol server lets agents query live architecture repositories in natural language and retrieve structured answers, which blurs lines between modeling and orchestration. Services revenue is also rising as consulting firms design governance frameworks and integrate agents with legacy systems.
Cloud deployment accounted for 55.32% of revenue in 2025, yet hybrid approaches are forecast to grow at a 57.53% CAGR, as enterprises balance innovation speed with data residency and cost optimization. The agent-oriented enterprise architecture market size for hybrid environments will expand as the European Union Data Act forces portability and exit strategies. Microsoft Azure supports SAP's 99.95% service-level agreement, enabling RISE with SAP customers to enhance recovery while maintaining sovereignty. Sovereign cloud spending is set to reach USD 80 billion in 2026, with 20% of workloads shifting to local providers.
On-premises remains essential for classified workloads, particularly in industries such as defense, healthcare, and financial services, where data security and compliance are critical. IBM offers Power Virtual Server for clients that need air-gapped SAP landscapes, ensuring secure environments with migration windows under 90 days. Enterprises increasingly view hybrid models as the default choice for managing regulated data, handling burst compute requirements, and executing cost-controlled batch jobs. This growing reliance on hybrid architectures has led to a rising demand for advanced orchestration layers. These layers enable seamless movement of agents and data across diverse environments while ensuring adherence to governance policies and regulatory standards, thereby addressing the complex needs of modern enterprises.
Geography Analysis
North America accounted for 37.48% of revenue in 2025, driven by mature cloud ecosystems and hyperscaler investments. Enterprises in the United States navigate decades of technical debt, integrating agents with mainframes and on-premises data centers, while embedding explainability and audit controls to meet regulatory scrutiny. SAP and Microsoft launched the Business Suite Acceleration Program that integrates Joule Copilot with Microsoft 365 Copilot, initially in the United States and expanding globally. IBM migrated global quote-to-cash and manufacturing processes to SAP S/4HANA Cloud Private, achieving a 30% reduction in infrastructure costs with 100% availability.
Asia-Pacific is forecast to grow at 57.37% over 2026-2031, propelled by national AI strategies in China, India, Japan, and South Korea. The Great Asia AI Summit in February 2026 underscored the shift from pilots to scaled, governed agentic models. Japanese startups in Shibuya build multi-agent software-as-a-service, while integrators in Shinagawa cut release cycles from weeks to hours. Manufacturing clusters deploy agents that monitor commodity and port data to adapt sourcing. India and Singapore accelerate adoption across financial services and the public sector by using cloud-native stacks.
Europe follows a governance-first path shaped by the EU AI Act and Data Act, which mandate portability, documentation, and sovereign cloud. Enterprises demand vendor-agnostic orchestration frameworks that embed compliance. SAP Business Data Cloud went live on Microsoft Azure in Switzerland in March 2026, giving customers EU Access and data sovereignty. SAP is expanding European data center capacity by 40% and forming sovereign cloud ventures such as Bleu in France. The Middle East is accelerating agent adoption within national AI strategies focused on smart government and utility optimization. South America and Africa are smaller today, but benefit from vendor programs that target mid-market clients with cloud-native offerings
- Sparx Systems Pty Ltd.
- Avolution Pty Ltd.
- BOC Group OOD
- BiZZdesign B.V.
- Orbus Software Ltd.
- LeanIX GmbH
- Ardoq AS
- QualiWare ApS
- Software AG
- Capsifi Pty Ltd.
- Dragon1 Inc.
- ValueBlue B.V.
- Salamander Digital OU
- Planview Inc.
- SAP SE
- IBM Corporation
- Amazon Web Services Inc.
- Microsoft Corporation
- Alphabet Inc.
Additional Benefits:
- The market estimate (ME) sheet in Excel format
- 3 months of analyst support
TABLE OF CONTENTS
1 INTRODUCTION
- 1.1 Study Assumptions and Market Definition
- 1.2 Scope of the Study
2 RESEARCH METHODOLOGY
3 EXECUTIVE SUMMARY
4 MARKET LANDSCAPE
- 4.1 Market Overview
- 4.2 Market Drivers
- 4.2.1 Rising Complexity of Heterogeneous IT Environments
- 4.2.2 Shift Toward Composable, Agent-Based Digital Platforms
- 4.2.3 Surge in Edge-to-Cloud Workload Orchestration Demands
- 4.2.4 Accelerating Adoption of Autonomous Business Processes
- 4.2.5 Growing Regulatory Pressure for Explainable AI Governance
- 4.2.6 Rapid Uptake of Digital Twin-Driven Enterprise Modeling
- 4.3 Market Restraints
- 4.3.1 Fragmentation of Interoperability Standards
- 4.3.2 Shortage of Agent-Oriented Design Skill Sets
- 4.3.3 High Integration Cost with Legacy EA Tooling
- 4.3.4 Perceived Security Risks in Distributed Agent Systems
- 4.4 Impact of Macroeconomic Factors on the Market
- 4.5 Industry Value Chain Analysis
- 4.6 Regulatory Landscape
- 4.7 Technological Outlook
- 4.8 Porter's Five Forces Analysis
- 4.8.1 Bargaining Power of Suppliers
- 4.8.2 Bargaining Power of Buyers
- 4.8.3 Threat of New Entrants
- 4.8.4 Threat of Substitutes
- 4.8.5 Intensity of Competitive Rivalry
5 MARKET SIZE AND GROWTH FORECASTS (VALUE)
- 5.1 By Product Type
- 5.1.1 Modelling Tools
- 5.1.2 Integrated Development Environments
- 5.1.3 Agent-Based Simulation Platforms
- 5.1.4 Middleware and Integration Software
- 5.1.5 Services
- 5.2 By Deployment Mode
- 5.2.1 On-Premises
- 5.2.2 Cloud
- 5.2.3 Hybrid
- 5.3 By Enterprise Size
- 5.3.1 Large Enterprises
- 5.3.2 Small and Medium Enterprises
- 5.4 By End-user Industry
- 5.4.1 BFSI
- 5.4.2 Government and Defense
- 5.4.3 Healthcare and Life Sciences
- 5.4.4 Manufacturing
- 5.4.5 IT and Telecom
- 5.4.6 Energy and Utilities
- 5.4.7 Retail and e-Commerce
- 5.4.8 Transportation and Logistics
- 5.4.9 Other End-User Industries
- 5.5 By Geography
- 5.5.1 North America
- 5.5.1.1 United States
- 5.5.1.2 Canada
- 5.5.1.3 Mexico
- 5.5.2 South America
- 5.5.2.1 Brazil
- 5.5.2.2 Argentina
- 5.5.2.3 Rest of South America
- 5.5.3 Europe
- 5.5.3.1 United Kingdom
- 5.5.3.2 Germany
- 5.5.3.3 France
- 5.5.3.4 Italy
- 5.5.3.5 Spain
- 5.5.3.6 Rest of Europe
- 5.5.4 Asia-Pacific
- 5.5.4.1 China
- 5.5.4.2 Japan
- 5.5.4.3 India
- 5.5.4.4 South Korea
- 5.5.4.5 Rest of Asia-Pacific
- 5.5.5 Middle East and Africa
- 5.5.5.1 Middle East
- 5.5.5.1.1 United Arab Emirates
- 5.5.5.1.2 Saudi Arabia
- 5.5.5.1.3 Rest of Middle East
- 5.5.5.2 Africa
- 5.5.5.2.1 South Africa
- 5.5.5.2.2 Egypt
- 5.5.5.2.3 Rest of Africa
- 5.5.5.1 Middle East
- 5.5.1 North America
6 COMPETITIVE LANDSCAPE
- 6.1 Market Concentration
- 6.2 Strategic Moves
- 6.3 Market Share Analysis
- 6.4 Company Profiles (includes Global Level Overview, Market Level Overview, Core Segments, Financials as available, Strategic Information, Market Rank/Share, Products and Services, Recent Developments)
- 6.4.1 Sparx Systems Pty Ltd.
- 6.4.2 Avolution Pty Ltd.
- 6.4.3 BOC Group OOD
- 6.4.4 BiZZdesign B.V.
- 6.4.5 Orbus Software Ltd.
- 6.4.6 LeanIX GmbH
- 6.4.7 Ardoq AS
- 6.4.8 QualiWare ApS
- 6.4.9 Software AG
- 6.4.10 Capsifi Pty Ltd.
- 6.4.11 Dragon1 Inc.
- 6.4.12 ValueBlue B.V.
- 6.4.13 Salamander Digital OU
- 6.4.14 Planview Inc.
- 6.4.15 SAP SE
- 6.4.16 IBM Corporation
- 6.4.17 Amazon Web Services Inc.
- 6.4.18 Microsoft Corporation
- 6.4.19 Alphabet Inc.
7 MARKET OPPORTUNITIES AND FUTURE OUTLOOK
- 7.1 White-Space and Unmet-Need Assessment

