
PUBLISHER: Mordor Intelligence | PRODUCT CODE: 2064409

PUBLISHER: Mordor Intelligence | PRODUCT CODE: 2064409
East Asia Renewable Energy - Market Share Analysis, Industry Trends & Statistics, Growth Forecasts (2026 - 2031)
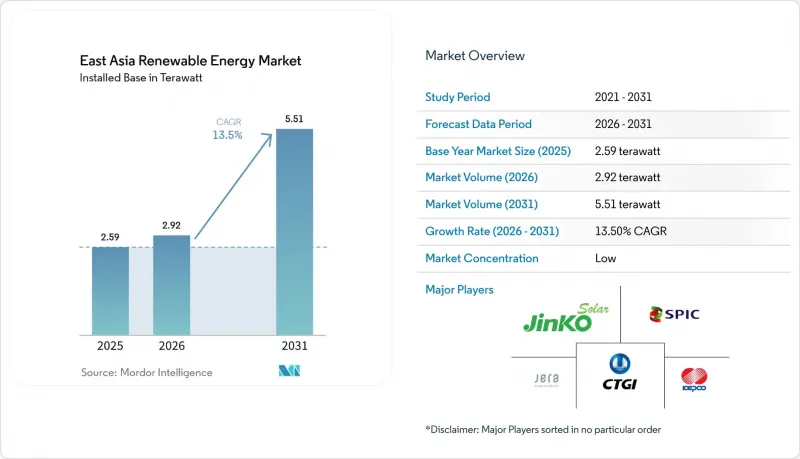
According to Mordor Intelligence, the east asia renewable energy market size in terms of installed base is projected to be 2.59 terawatt in 2025, 2.92 terawatt in 2026, and reach 5.51 terawatt by 2031, growing at a CAGR of 13.5% from 2026 to 2031.
This report is Segmented by Technology (Solar Energy, Wind Energy, Hydropower, Bioenergy, Geothermal, Ocean Energy), End-User (Utilities, Commercial and Industrial, Residential), and Geography (China, Japan, South Korea, Taiwan, Rest of East Asia). The Market Forecasts are Provided in Terms of Volume (TW).
East Asia Renewable Energy Market Trends and Insights
Government Decarbonization Mandates & Subsidy Mechanisms
Regional policy frameworks now embed gigawatt-scale targets in economic planning. China's 15th Five-Year Plan ties provincial GDP metrics to renewable roll-outs, ensuring political accountability for capacity gains. Japan's seventh Strategic Energy Plan finalized in 2024 raised the 2040 renewable electricity goal to 50% and switched to feed-in-premium auctions that flex with wholesale prices, reducing fiscal exposure while safeguarding developer cash flows. South Korea's RE3020 requires public institutions to source 35% of power from renewables by 2030, already catalyzing 18 utility-scale solar tenders in 2025. Taiwan legislated a USD 28 billion offshore wind and green hydrogen fund through 2030, monitored quarterly by the Bureau of Energy. Together these programs imply a regional carbon price floor near USD 45 per ton, rendering unabated coal uncompetitive before the decade's end.
Rapid LCOE Decline for Solar PV & Wind
Asia-Pacific solar and wind levelized costs fell 16% in 2024 as polysilicon oversupply, N-type cell efficiencies above 25%, and bifacial adoption near 70% drove module prices to USD 0.09 per watt. China's utility-scale PV averaged USD 27 per MWh in 2024, undercutting gas by 35%. Inner Mongolia wind auctions cleared at USD 31 per MWh in 2025 thanks to 6.5 MW turbines with 180-meter rotors. Offshore wind remains pricier, yet localized supply chains in Jeollanam-do aim for USD 55 per MWh by 2028 as Doosan Enerbility's 15 MW nacelles reach volume scale. Continuous cost compression widens the East Asia renewable energy market addressable base and encourages hybrid storage pairings that secure evening-peak premiums.
Grid Congestion & Curtailment Risk
Solar curtailment in China hit 9.2% during Jan-Feb 2026 as 180 GW of 2025 additions outpaced transmission growth. Tibet dumped 17% of midday solar because a lone 3 GW line serves a 400 MW load. State Grid has earmarked CNY 650 billion for five new ultra-high-voltage corridors through 2027, yet typical build times run up to four years. Hokkaido's curtailment drop post-HVDC shows targeted links can resolve bottlenecks, but Korea still caps variable renewable share at 25% without co-located storage. Persistent congestion restrains near-term additions and trims the East Asia renewable energy market growth runway.
Other drivers and restraints analyzed in the detailed report include:
- Corporate-PPA Boom from Data-Center & Heavy-Industry Buyers
- Cross-Border HVDC Super-Grid Build-Out
- Land-Use & Permitting Delays for Onshore Assets
For complete list of drivers and restraints, kindly check the Table Of Contents.
Segment Analysis
Solar Energy commanded 53.1% of installed capacity in 2025. Continuous cost declines, desert mega-bases, and rooftop mandates cement its primacy, though polysilicon audits bifurcate supply chains. Ocean Energy's low 2025 base under 300 MW underpins its 43.4% CAGR, with South Korea's Sihwa barrage and Japan's Proteus turbine signaling commercial readiness.
Turbine scaling lifts wind contributions; 16 MW platforms now generate 80 GWh annually, doubling 2020 units. Pumped-storage hydro like China's 3.6 GW Fengning plant stabilizes variable output, while geothermal additions in Kyushu diversify Japan's mix. Concentrating solar and bioenergy stay niche as PV costs plunge below USD 0.10 per watt. Ocean technology pilot success could expand the East Asia renewable energy market frontier beyond traditional resources.
List of Companies Covered in this Report:
- State Power Investment Corporation (SPIC)
- China Three Gorges Corp (CTG)
- JinkoSolar Holding Co Ltd
- LONGi Green Energy Technology Co Ltd
- Xinjiang Goldwind Science & Technology Co Ltd
- Trina Solar Ltd
- JA Solar Technology Co Ltd
- Siemens Gamesa Renewable Energy SA
- Vestas Wind Systems A/S
- Eurus Energy Holdings Corp
- Korea Electric Power Corp (KEPCO)
- JERA Co Inc
- Mitsubishi Corp (Renewables)
- Orsted A/S (Taiwan JV)
- CGN New Energy Holdings Co Ltd
- Shenergy Group Co Ltd
- Tokyo Electric Power Renewable Power Co
- Hanwha Q-Cells Co Ltd
- SK E&S Co Ltd
- Orsted Japan KK
Additional Benefits:
- The market estimate (ME) sheet in Excel format
- 3 months of analyst support
TABLE OF CONTENTS
1 Introduction
- 1.1 Study Assumptions & Market Definition
- 1.2 Scope of the Study
2 Research Methodology
3 Executive Summary
4 Market Landscape
- 4.1 Market Overview
- 4.2 Market Drivers
- 4.2.1 Government decarbonisation mandates & subsidy mechanisms
- 4.2.2 Rapid LCOE decline for solar PV & wind
- 4.2.3 Corporate-PPA boom from data-centre & heavy-industry buyers
- 4.2.4 Cross-border HVDC "super-grid" build-out (CN-JP-KR)
- 4.2.5 Localised offshore-wind manufacturing clusters (Fujian, Jeollanam)
- 4.2.6 AI-driven generation forecasting raising grid-penetration ceilings
- 4.3 Market Restraints
- 4.3.1 Grid congestion & curtailment risk
- 4.3.2 Land-use & permitting delays for onshore assets
- 4.3.3 Polysilicon price-spikes from Xinjiang audit squeeze
- 4.3.4 Typhoon-zone insurance premia for offshore wind farms
- 4.4 Supply-Chain Analysis
- 4.5 Regulatory Landscape
- 4.6 Technological Outlook
- 4.7 Porter's Five Forces
- 4.7.1 Bargaining Power of Suppliers
- 4.7.2 Bargaining Power of Buyers
- 4.7.3 Threat of New Entrants
- 4.7.4 Threat of Substitutes
- 4.7.5 Competitive Rivalry
5 Market Size & Growth Forecasts
- 5.1 By Technology
- 5.1.1 Solar Energy (PV and CSP)
- 5.1.2 Wind Energy (Onshore and Offshore)
- 5.1.3 Hydropower (Small, Large, PSH)
- 5.1.4 Bioenergy
- 5.1.5 Geothermal
- 5.1.6 Ocean Energy (Tidal and Wave)
- 5.2 By End-User
- 5.2.1 Utilities
- 5.2.2 Commercial and Industrial
- 5.2.3 Residential
- 5.3 By Geography
- 5.3.1 China
- 5.3.2 Japan
- 5.3.3 South Korea
- 5.3.4 Taiwan
- 5.3.5 Rest of East Asia (Mongolia, Hong Kong, Macau)
6 Competitive Landscape
- 6.1 Market Concentration
- 6.2 Strategic Moves (M&A, JVs, Funding, PPAs)
- 6.3 Market Share Analysis (Market Rank/Share for key companies)
- 6.4 Company Profiles (includes Global-level Overview, Market-level Overview, Core Segments, Financials, Strategic Information, Products & Services, Recent Developments)
- 6.4.1 State Power Investment Corporation (SPIC)
- 6.4.2 China Three Gorges Corp (CTG)
- 6.4.3 JinkoSolar Holding Co Ltd
- 6.4.4 LONGi Green Energy Technology Co Ltd
- 6.4.5 Xinjiang Goldwind Science & Technology Co Ltd
- 6.4.6 Trina Solar Ltd
- 6.4.7 JA Solar Technology Co Ltd
- 6.4.8 Siemens Gamesa Renewable Energy SA
- 6.4.9 Vestas Wind Systems A/S
- 6.4.10 Eurus Energy Holdings Corp
- 6.4.11 Korea Electric Power Corp (KEPCO)
- 6.4.12 JERA Co Inc
- 6.4.13 Mitsubishi Corp (Renewables)
- 6.4.14 Orsted A/S (Taiwan JV)
- 6.4.15 CGN New Energy Holdings Co Ltd
- 6.4.16 Shenergy Group Co Ltd
- 6.4.17 Tokyo Electric Power Renewable Power Co
- 6.4.18 Hanwha Q-Cells Co Ltd
- 6.4.19 SK E&S Co Ltd
- 6.4.20 Orsted Japan KK
7 Market Opportunities & Future Outlook
- 7.1 White-space & Unmet-Need Assessment

