PUBLISHER: Mordor Intelligence | PRODUCT CODE: 2072652

PUBLISHER: Mordor Intelligence | PRODUCT CODE: 2072652
United States Discrete GPU - Market Share Analysis, Industry Trends & Statistics, Growth Forecasts (2026 - 2031)
According to Mordor Intelligence, the united states discrete GPU market size was valued at USD 16.67 billion in 2025 and estimated to grow from USD 19.09 billion in 2026 to reach USD 42.20 billion by 2031, at a CAGR of 17.19% during the forecast period (2026-2031).
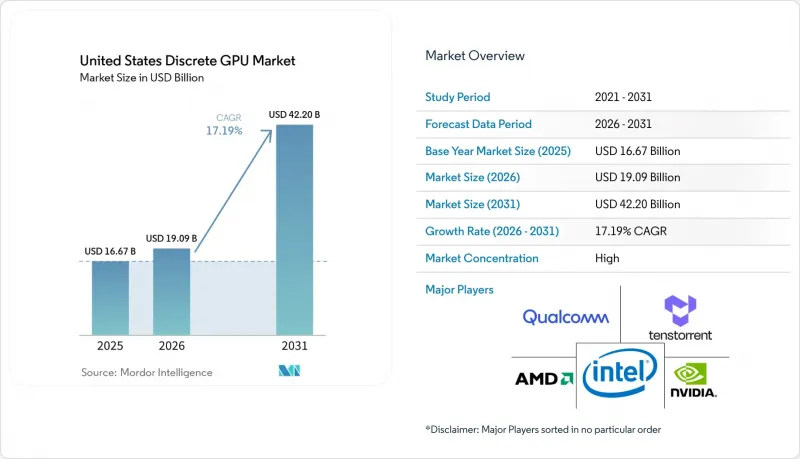
This report is Segmented by Device Application (Mobile Devices and Tablets, Pcs and Workstations, Servers and Datacenter Accelerators, Gaming Consoles, and More), Memory Type (GDDR-Based GPUs, and HBM-Based GPUs), Performance Tier (Low-Cost GPUs, Mainstream GPUs, High-Performance Consumer GPUs, and Data Center/AI Accelerator GPUs). The Market Forecasts are Provided in Terms of Value (USD).
United States Discrete GPU Market Trends and Insights
Proliferation Of AI And Machine Learning Workloads In Data Centers
Hyperscalers have moved from episodic refresh cycles to continuous fleet expansion, driven by large-language-model inference that demands sustained compute availability. OpenAI signed a multi-year contract for AMD Instinct MI400 accelerators equal to 6 GW of datacenter capacity, while Meta committed to a matching 6 gigawatts in early 2026. Despite record construction, only 23% of planned U.S. data-center capacity through 2026 has secured firm utility interconnects, tilting procurement criteria toward performance-per-watt. NVIDIA's Rubin platform addresses this by cutting idle draw 40% through liquid cooling and dynamic voltage scaling.Vendors demonstrating sub-300-watt TDP for inference stand to win disproportionate allocations as grid constraints tighten.
CHIPS Act Subsidies Stimulating Domestic GPU Production
Federal incentives are re-shaping the production map. Intel's USD 7.86 billion award funds four advanced fabs that will bring 18-angstrom process capacity onstream in 2027. TSMC's Arizona complex, backed by USD 6.6 billion, adds six fabs plus advanced CoWoS packaging, enabling onshore integration of HBM stacks. Close proximity between design, fab, and packaging is projected to compress tape-out-to-volume timelines from 18 months to under 12 months. Micron's planned HBM facility in New York further diversifies supply, mitigating reliance on overseas memory providers.
Supply Chain Vulnerability To Advanced Node Manufacturing Capacity
TSMC and Samsung control above 90% of global sub-7-nanometer capacity, and both are running at near-full utilization through 2026. NVIDIA's Blackwell GPUs rely on TSMC's 4 nm process with CoWoS -L packaging that is also used by Apple's A-series processors, lengthening lead times for GPU wafers. AMD's MI400 uses TSMC 3 nm, yet volume is capped until late 2026. Although Intel's 18-angstrom node provides a prospective hedge, its yields remain unproven. Limited foundry headroom empowers incumbents with multiyear wafer agreements while constraining new entrants.
Other drivers and restraints analyzed in the detailed report include:
- Expansion Of Cloud Gaming Infrastructure Across The United States
- Rise In High-Resolution Gaming And Esports Monitor Adoption
- Growing Energy Consumption Concerns Of High-End GPUs In Data Centers
For complete list of drivers and restraints, kindly check the Table Of Contents.
Segment Analysis
Servers and datacenter accelerators accounted for 41.62% of shipments in 2025 within the United States discrete GPU market, reflecting the pivot from gamer-centric demand to AI inference clusters. The United States discrete GPU market size attributed to this segment is set to widen further as hyperscalers deploy millions of additional accelerators under multi-year roadmaps. PCs and workstations, once the backbone of volumes, now trail at roughly 30%, pressured by integrated GPU gains and longer replacement cycles. Gaming consoles remain niche, while automotive ADAS designs such as NVIDIA DRIVE Thor introduce fresh high-ASP pockets.
The remainder of the unit volume is split across mobile, embedded vision, and edge servers, each consuming specialized SKUs. Edge inference gateways in retail analytics, smart factories, and healthcare imaging illustrate early but material opportunities. Given sustained hyperscaler appetite, datacenter demand has become secular rather than cyclical, positioning the segment to surpass 50% of the United States discrete GPU market revenues before 2028.
Complete Report Scope:
- By Device Application
- Mobile Devices and Tablets
- PCs and Workstations
- Servers and Datacenter Accelerators
- Gaming Consoles and Handhelds
- Automotive / ADAS
- Other Embedded and Edge Devices
- By Memory Type
- GDDR-based GPUs
- HBM-based GPUs
- By Performance Tier
- Low-Cost GPUs (less than 100 USD)
- Mainstream GPUs (100 USD to 400 USD)
- High-Performance Consumer GPUs (400 USD to 1,200 USD)
- Data Center / AI Accelerator GPUs (greater than 1,200 USD)
List of Companies Covered in this Report:
- NVIDIA Corporation
- Advanced Micro Devices, Inc.
- Intel Corporation
- Qualcomm Technologies, Inc.
- Apple Inc.
- Samsung Electronics Co., Ltd.
- Imagination Technologies Limited
- Arm Holdings plc
- Tenstorrent Inc.
- Graphcore Ltd.
- Cerebras Systems Inc.
- Broadcom Inc.
- Marvell Technology, Inc.
- ASUSTeK Computer Inc.
- Giga-Byte Technology Co., Ltd.
- ASRock Inc.
- EVGA Corporation
- Super Micro Computer, Inc.
- Dell Technologies Inc.
- Hewlett Packard Enterprise Company
Additional Benefits:
- The market estimate (ME) sheet in Excel format
- 3 months of analyst support
TABLE OF CONTENTS
1 INTRODUCTION
- 1.1 Study Assumptions and Market Definition
- 1.2 Scope of the Study
2 RESEARCH METHODOLOGY
3 EXECUTIVE SUMMARY
4 MARKET LANDSCAPE
- 4.1 Market Overview
- 4.2 Market Drivers
- 4.2.1 Proliferation of AI and Machine Learning Workloads in Data Centers
- 4.2.2 Rise in High-Resolution Gaming and Esports Monitor Adoption
- 4.2.3 Expansion of Cloud Gaming Infrastructure Across the United States
- 4.2.4 Accelerated Content Creation Demands in Media and Entertainment Workflows
- 4.2.5 CHIPS Act Subsidies Stimulating Domestic GPU Production
- 4.2.6 Automotive OEM Adoption of Discrete GPUs for Advanced Driver-Assistance Systems
- 4.3 Market Restraints
- 4.3.1 Supply Chain Vulnerability to Advanced Node Manufacturing Capacity
- 4.3.2 Growing Energy Consumption Concerns of High-End GPUs in Data Centers
- 4.3.3 Cannibalization by Integrated GPUs in Entry-Level PCs
- 4.3.4 Geopolitical Export Controls Limiting Chinese Foundry Collaboration
- 4.4 Industry Value-Chain Analysis
- 4.5 Regulatory Landscape
- 4.6 Technological Outlook
- 4.7 Impact of Macroeconomic Factors on the Market
- 4.8 Porter's Five Forces Analysis
- 4.8.1 Threat of New Entrants
- 4.8.2 Bargaining Power of Suppliers
- 4.8.3 Bargaining Power of Buyers
- 4.8.4 Threat of Substitutes
- 4.8.5 Competitive Rivalry
5 MARKET SIZE AND GROWTH FORECASTS (VALUE)
- 5.1 By Device Application
- 5.1.1 Mobile Devices and Tablets
- 5.1.2 PCs and Workstations
- 5.1.3 Servers and Datacenter Accelerators
- 5.1.4 Gaming Consoles and Handhelds
- 5.1.5 Automotive / ADAS
- 5.1.6 Other Embedded and Edge Devices
- 5.2 By Memory Type
- 5.2.1 GDDR-based GPUs
- 5.2.2 HBM-based GPUs
- 5.3 By Performance Tier
- 5.3.1 Low-Cost GPUs (less than 100 USD)
- 5.3.2 Mainstream GPUs (100 USD to 400 USD)
- 5.3.3 High-Performance Consumer GPUs (400 USD to 1,200 USD)
- 5.3.4 Data Center / AI Accelerator GPUs (greater than 1,200 USD)
6 COMPETITIVE LANDSCAPE
- 6.1 Market Concentration
- 6.2 Strategic Moves
- 6.3 Market Share Analysis
- 6.4 Company Profiles (includes Global Level Overview, Market Level Overview, Core Segments, Financials as available, Strategic Information, Market Rank/Share, Products and Services, Recent Developments)
- 6.4.1 NVIDIA Corporation
- 6.4.2 Advanced Micro Devices, Inc.
- 6.4.3 Intel Corporation
- 6.4.4 Qualcomm Technologies, Inc.
- 6.4.5 Apple Inc.
- 6.4.6 Samsung Electronics Co., Ltd.
- 6.4.7 Imagination Technologies Limited
- 6.4.8 Arm Holdings plc
- 6.4.9 Tenstorrent Inc.
- 6.4.10 Graphcore Ltd.
- 6.4.11 Cerebras Systems Inc.
- 6.4.12 Broadcom Inc.
- 6.4.13 Marvell Technology, Inc.
- 6.4.14 ASUSTeK Computer Inc.
- 6.4.15 Giga-Byte Technology Co., Ltd.
- 6.4.16 ASRock Inc.
- 6.4.17 EVGA Corporation
- 6.4.18 Super Micro Computer, Inc.
- 6.4.19 Dell Technologies Inc.
- 6.4.20 Hewlett Packard Enterprise Company
7 MARKET OPPORTUNITIES AND FUTURE OUTLOOK
- 7.1 White-space and Unmet-Need Assessment

