PUBLISHER: Mordor Intelligence | PRODUCT CODE: 2073113

PUBLISHER: Mordor Intelligence | PRODUCT CODE: 2073113
Open Gear Lubricants - Market Share Analysis, Industry Trends & Statistics, Growth Forecasts (2026 - 2031)
According to Mordor Intelligence, the open gear lubricants market size is expected to increase from USD 765.70 million in 2025 to USD 794.34 million in 2026 and reach USD 954.42 million by 2031, growing at a CAGR of 3.74% over 2026-2031.
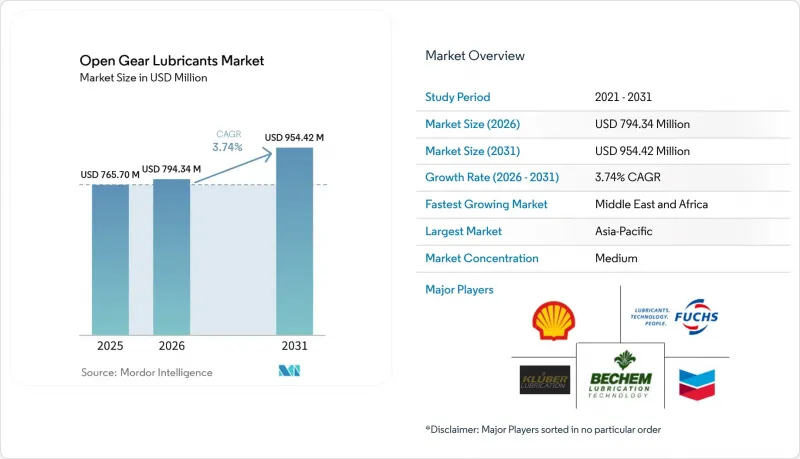
This report is Segmented by Base Oil (Mineral Oil, Synthetic Oil, and Bio-Based Oil), End-User Industry (Mining, Cement, Construction, Power Generation, Oil And Gas, Marine, and Others), and Geography (Asia-Pacific, North America, Europe, South America, and Middle-East, and Africa). The Market Sizes and Forecasts are Provided in Terms of Value (USD).
Global Open Gear Lubricants Market Trends and Insights
Rising Demand from Mining and Cement Expansion
Expansions of copper and iron-ore mines in Chile, Peru, and Indonesia, coupled with the introduction of new kilns in Saudi Arabia, are driving up annual lubricant consumption. These lubricants are essential for grinding mills and rotary kilns that operate continuously. Given that failures in kiln gears can halt production and incur substantial costs, procurement teams are now prioritizing high-load Timken ratings over the initial price of lubricants. Synthetic open-gear products from Kluber have reduced lubricant consumption and lowered operating temperatures, leading to noticeable improvements in operational uptime. Additionally, centralized spray systems are minimizing waste by precisely dosing lubricant with each gear rotation. As a result, the focus has shifted from the price per liter to the overall life-cycle cost.
Growth in Bio-Based Lubricants Adoption
The Environmental Protection Agency Vessel Incidental Discharge Act rule mandates that large vessels use environmentally acceptable lubricants at oil-to-sea interfaces. This requirement is expected to drive the demand for biodegradable products that break down within a specified timeframe. Castrol's carbon-neutral BioTac OG, certified to PAS 2060, showcases the evolution of bio-based greases, achieving high biodegradability alongside strong Four-Ball Extreme Pressure weld points. To address spill liabilities and meet corporate sustainability goals, offshore wind farms and coastal cement terminals are increasingly turning to bio-esters. This transition is further bolstered by Europe's OSPAR convention and impending bans on per- and polyfluoroalkyl substances, spurring swift adoption among North Sea marine fleets. Suppliers boasting original equipment manufacturer approvals for bio-based formulations are emerging as preferred vendors in bid assessments. With life-cycle carbon accounting gaining traction in boardrooms, offerings in the bio-based open gear lubricants market are poised to secure long-term contracts, even with a price premium over traditional mineral oils.
Geopolitical Supply-Chain Instability
Disruptions in the Strait of Hormuz, through which a significant portion of Europe's Group II base stocks transit, can lead to a substantial increase in blending costs within a short period. A diversion to the Red Sea extended lead times considerably, compelling just-in-time cement plants to rely on emergency mineral-oil inventories at a higher cost. While North American blenders have turned to domestic sourcing of polyalphaolefin as a hedge, the transition to synthetic stocks requires an extensive process involving laboratory testing and original equipment manufacturer reapproval. Spot prices for Group II oils have risen significantly, squeezing profit margins for independent blenders.
Other drivers and restraints analyzed in the detailed report include:
- Increasing Uptake of Synthetic Base Oils
- AI-Enabled Predictive Maintenance Lowering Lubricant Wastage
- Emerging PFAS Restrictions Affect Legacy Chemistries
For complete list of drivers and restraints, kindly check the Table Of Contents.
Segment Analysis
Mineral oils captured 43.56% of the open gear lubricants market share in 2025, thanks to entrenched use in cost-sensitive Asian cement kilns, where buyers still purchase by the drum rather than by equipment life results. The segment is projected to expand at a 3.68% CAGR during 2026-2031. As legacy assets in India and Indonesia come online, synthetics are challenging this dominance. Polyalphaolefin and Group III blends now account for a significant portion of North American sales, driven by the International Electrotechnical Commission mandate for wind-turbine gearboxes. In the cement sector, Kluber's field data reveals that synthetics reduce consumption and operating temperatures, persuading multinationals to adopt premium grades as the standard. While bio-based esters currently hold a small market share, they are witnessing substantial growth, especially where VIDA compliance is essential for deck machinery. Blenders merging bio-esters with polyalphaolefin to expand the temperature range could tap into new revenue streams in Asia's marine sector. Given the technical advantages and regulatory incentives, synthetics are poised to surpass mineral oils in value terms long before the end of the decade, even if their volumes remain subdued due to lower consumption rates.
The market for synthetic oils in open gear lubricants is projected to expand significantly, marking it as the most rapidly advancing segment in the larger market. With original equipment manufacturer-endorsed nano-additives becoming commonplace in kiln and mill gearboxes, mineral oils face the threat of being confined to niche, price-driven applications. In response, suppliers are pairing high-margin synthetics with digital monitoring services, aiming to safeguard their market share and establish enduring service contracts. Concurrently, as Group I mineral capacities dwindle in Europe, supply tightens, and the price gap to Group III narrows. This shift highlights why procurement teams are now prioritizing total cost of ownership over mere invoice price, hastening the industry's pivot towards synthetics.
Complete Report Scope:
- By Base Oil
- Mineral Oil
- Synthetic Oil
- Bio-based Oil
- By End-user Industry
- Mining
- Cement
- Construction
- Power Generation
- Oil and Gas
- Marine
- Others
- By Geography
- Asia-Pacific
- China
- India
- Japan
- South Korea
- ASEAN Countries
- Rest of Asia-Pacific
- North America
- United States
- Canada
- Mexico
- Europe
- Germany
- United Kingdom
- France
- Italy
- Spain
- Russia
- Nordic Countries
- Rest of Europe
- South America
- Brazil
- Argentina
- Rest of South America
- Middle-East and Africa
- Saudi Arabia
- South Africa
- Rest of Middle-East and Africa
- Asia-Pacific
Geography Analysis
Asia-Pacific generated 35.40% of global revenue in 2025. China's robust heavy-industry foundation, coupled with India's cement expansion, is steering the region's industrial narrative. Sinopec's expansion in Tianjin is set to boost the supply of humidity-resistant open-gear products, coinciding with the launch of nickel and copper smelters in Indonesia. The region's technical prowess is evident as Japanese and South Korean inputs shape International Electrotechnical Commission gearbox standards, guiding original equipment manufacturers towards adopting low-temperature polyalphaolefin blends. In a bid to address labor shortages at its remote Pilbara sites, Australian iron-ore miners are turning to automatic spray systems, further emphasizing the industry's shift towards synthetic solutions.
The Middle East and Africa is the fastest-growing territory at 3.82% CAGR during 2026-2031. Saudi Vision 2030's infrastructure projects are fueling continuous cement production. In Riyadh, kilns face extreme ambient temperatures and abrasive sand, increasing the demand for high-viscosity synthetics that resist wash-off. South Africa's platinum revival encounters similar high-dust challenges; however, centralized lubrication systems have proven effective in significantly reducing unplanned downtime in underground shafts. North African marine hubs, with Egypt's new Mediterranean ports leading the charge, are adopting bio-based greases for dockside cranes, aligning with International Maritime Organization pollution protocols. Yet, regional political volatility occasionally inflates freight premiums for imported base oils, steering buyers towards locally packaged synthetics.
While North America and Europe may lag in overall growth, they wield significant influence over chemistry trends, largely due to stringent environmental regulations. Europe's open gear lubricants market is expected to grow modestly, but the prohibition of per- and polyfluoroalkyl substances threatens to overhaul product lineups. In the United States, offshore operators are phasing out mineral oils in stern tubes, a move aimed at securing drilling permits under Vessel Incidental Discharge Act regulations, subsequently boosting demand for polyalphaolefin and ester environmentally acceptable lubricants. The British Gear Association's endorsement of International Electrotechnical Commission standards is further propelling wind-sector demand in the United Kingdom and Nordic regions. Meanwhile, South America, particularly Chile and Peru, is witnessing robust volume growth driven by copper expansion. However, logistical challenges in the Andes mines are inflating prices for centralized lubrication systems, which are often flown in from the United States or Europe.
- Bel-Ray Company LLC
- BP p.l.c.
- Carl Bechem GmbH
- Castrol Limited
- Chevron Corporation
- Exxon Mobil Corporation
- FUCHS
- Gulf Oil Lubricants
- Idemitsu Kosan Co. Ltd.
- Kluber Lubrication
- Lubrication Engineers Inc.
- Lubriplate Lubricants Company
- Petro-Canada Lubricants
- Petron Corporation
- Phillips 66 Lubricants
- Shell plc
- Sinopec Lubricants
- Specialty Lubricants Corporation
- TotalEnergies
- Valvoline Inc.
- Whitmore Manufacturing LLC.
Additional Benefits:
- The market estimate (ME) sheet in Excel format
- 3 months of analyst support
TABLE OF CONTENTS
1 Introduction
- 1.1 Study Assumptions and Market Definition
- 1.2 Scope of the Study
2 Research Methodology
3 Executive Summary
4 Market Landscape
- 4.1 Market Overview
- 4.2 Market Drivers
- 4.2.1 Rising demand from mining and cement expansion
- 4.2.2 Growth in bio-based lubricants adoption
- 4.2.3 Increasing uptake of synthetic base oils
- 4.2.4 AI-enabled predictive maintenance lowering lubricant wastage
- 4.2.5 OEM-approved nano-additive packages extending gear life
- 4.2.6 Shift toward centralized spray systems in high-altitude mines
- 4.3 Market Restraints
- 4.3.1 Geopolitical supply-chain instability
- 4.3.2 Application difficulties with large-diameter open gears
- 4.3.3 Emerging PFAS restrictions affecting legacy chemistries
- 4.3.4 Skill shortage for advanced lubrication audits in developing regions
- 4.4 Value Chain Analysis
- 4.5 Porter's Five Forces
- 4.5.1 Threat of New Entrants
- 4.5.2 Bargaining Power of Buyers
- 4.5.3 Bargaining Power of Suppliers
- 4.5.4 Threat of Substitutes
- 4.5.5 Competitive Rivalry
5 Market Size and Growth Forecasts (Value)
- 5.1 By Base Oil
- 5.1.1 Mineral Oil
- 5.1.2 Synthetic Oil
- 5.1.3 Bio-based Oil
- 5.2 By End-user Industry
- 5.2.1 Mining
- 5.2.2 Cement
- 5.2.3 Construction
- 5.2.4 Power Generation
- 5.2.5 Oil and Gas
- 5.2.6 Marine
- 5.2.7 Others
- 5.3 By Geography
- 5.3.1 Asia-Pacific
- 5.3.1.1 China
- 5.3.1.2 India
- 5.3.1.3 Japan
- 5.3.1.4 South Korea
- 5.3.1.5 ASEAN Countries
- 5.3.1.6 Rest of Asia-Pacific
- 5.3.2 North America
- 5.3.2.1 United States
- 5.3.2.2 Canada
- 5.3.2.3 Mexico
- 5.3.3 Europe
- 5.3.3.1 Germany
- 5.3.3.2 United Kingdom
- 5.3.3.3 France
- 5.3.3.4 Italy
- 5.3.3.5 Spain
- 5.3.3.6 Russia
- 5.3.3.7 Nordic Countries
- 5.3.3.8 Rest of Europe
- 5.3.4 South America
- 5.3.4.1 Brazil
- 5.3.4.2 Argentina
- 5.3.4.3 Rest of South America
- 5.3.5 Middle-East and Africa
- 5.3.5.1 Saudi Arabia
- 5.3.5.2 South Africa
- 5.3.5.3 Rest of Middle-East and Africa
- 5.3.1 Asia-Pacific
6 Competitive Landscape
- 6.1 Market Concentration
- 6.2 Strategic Moves
- 6.3 Market Share/Ranking Analysis
- 6.4 Company Profiles (includes Global level Overview, Market level overview, Core Segments, Financials, Strategic Information, Products and Services, Recent Developments)
- 6.4.1 Bel-Ray Company LLC
- 6.4.2 BP p.l.c.
- 6.4.3 Carl Bechem GmbH
- 6.4.4 Castrol Limited
- 6.4.5 Chevron Corporation
- 6.4.6 Exxon Mobil Corporation
- 6.4.7 FUCHS
- 6.4.8 Gulf Oil Lubricants
- 6.4.9 Idemitsu Kosan Co. Ltd.
- 6.4.10 Kluber Lubrication
- 6.4.11 Lubrication Engineers Inc.
- 6.4.12 Lubriplate Lubricants Company
- 6.4.13 Petro-Canada Lubricants
- 6.4.14 Petron Corporation
- 6.4.15 Phillips 66 Lubricants
- 6.4.16 Shell plc
- 6.4.17 Sinopec Lubricants
- 6.4.18 Specialty Lubricants Corporation
- 6.4.19 TotalEnergies
- 6.4.20 Valvoline Inc.
- 6.4.21 Whitmore Manufacturing LLC.
7 Market Opportunities and Future Outlook
- 7.1 White-space and Unmet-Need Assessment
- 7.2 Subsidised Cool Roofs for Low-income Urban Housing

