PUBLISHER: Mordor Intelligence | PRODUCT CODE: 2073274

PUBLISHER: Mordor Intelligence | PRODUCT CODE: 2073274
China Green IT Software - Market Share Analysis, Industry Trends & Statistics, Growth Forecasts (2026 - 2031)
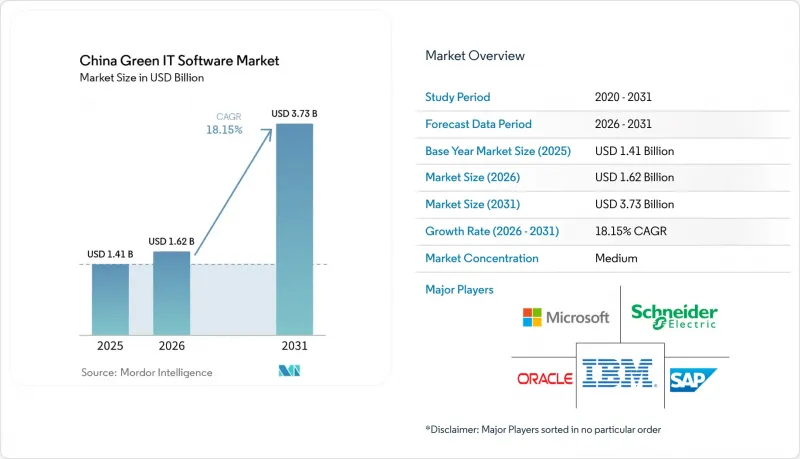
According to Mordor Intelligence, the china green IT software market size is projected to be USD 1.41 billion in 2025, USD 1.62 billion in 2026, and reach USD 3.73 billion by 2031, growing at a CAGR of 18.15% from 2026 to 2031.
This report is Segmented by Offering (Software, and Services), Solution Type (Carbon Accounting and Reporting Software, and More), Deployment (Cloud-Based, and More), Organization Size (Large Enterprises, and Small and Medium Enterprises), End-User Industry (Information Technology and Telecommunications, and More). The Market Forecasts are Provided in Terms of Value (USD).
China Green IT Software Market Trends and Insights
Dual-Carbon Policy Momentum and Compliance Digitization
The China green IT software market is gaining direct support from policy measures that now specify how industrial firms should build energy and carbon data systems, rather than only stating long-term emissions goals. The March 2025 guidelines for digital energy-carbon management centers set a clearer architecture baseline for industrial enterprises and parks, which raises the minimum technical standard that software vendors must meet in procurement processes. The January 2025 product carbon footprint accounting guidelines added another layer of demand by pushing manufacturers toward standardized product-level carbon management across supply chains, which broadens the use case beyond facility reporting alone. This policy pattern matters because it shifts software buying from one-time compliance projects toward recurring platform investment, especially where factories, parks, and enterprise groups need common data structures. In the China green IT software market, this change supports vendors that can align system design with national reporting logic while still fitting enterprise workflows. It also creates room for long-term account expansion, because once the first reporting layer is installed, enterprises usually need additional modules for product data, audit support, and supplier engagement.
Rising Enterprise Demand for Automated Carbon Accounting
The China green IT software market is also benefiting from the move away from spreadsheet-based carbon tracking toward automated and auditable reporting workflows. Enterprises now need stronger data traceability, cleaner approval chains, and more direct links between operational records and disclosure outputs, which favors platforms embedded in finance, ERP, and cloud environments. Kingdee's FY2025 results showed that its cloud subscription revenue rose 20.9% year on year to RMB 3,556 million, or USD 488 million, while its Kingdee AI platform deployed nearly 20 AI agents across use cases that included ESG scenarios. That result is commercially important because it shows that automated ESG and carbon reporting functions are moving into mainstream enterprise software spending rather than remaining niche sustainability tools. In the China green IT software market, this gives an advantage to vendors that can automate data collection and validation inside systems enterprises already use for financial and operating control. It also raises switching costs over time, since once carbon workflows are linked to core records and approvals, enterprises are less willing to return to manual reporting or disconnected specialist tools.
Fragmented Emissions Data and Weak System Interoperability
Fragmented data remains one of the clearest operating limits on the China green IT software market, because many enterprises still manage production, procurement, facility, and logistics records across disconnected systems. A 2024 study published by the Strategic Study of the Chinese Academy of Engineering highlighted the lack of a credible and unified emissions factor database across industrial sectors, which makes it harder to produce comparable and auditable carbon inventories. This problem is larger than a basic software integration issue, because different source systems often define boundaries, units, and activity categories in ways that do not match regulatory reporting needs. Enterprises may therefore have the software budget and the reporting obligation, yet still struggle to generate records that external reviewers can reconcile without manual correction. In the China green IT software market, which slows implementation cycles and keeps service intensity high, because vendors often need to spend significant time on data mapping before customers see full platform value. It also protects incumbents once they solve the integration layer, since replacement becomes harder after custom data structures and workflows are in place.
Other drivers and restraints analyzed in the detailed report include:
- AI Enabled Energy Optimization Across Data Centers and Industrial IT
- Expanding ESG Disclosure Requirements Across Export-Oriented Firms
- Limited In-House Sustainability Data Governance in Small and Medium Enterprises
For complete list of drivers and restraints, kindly check the Table Of Contents.
Segment Analysis
Software continues to dominate China green IT software market, holding a 67.41% share in 2025, driven by enterprise demand for integrated tools like carbon accounting and ESG disclosure systems within ERP and cloud environments. Businesses increasingly rely on software for centralized records, automated calculations, and reusable reporting structures, reducing manual interventions and enhancing governance and continuity. As procurement strategies evolve, buyers prioritize integration depth, scalability, and workflow traceability, favoring vendors offering comprehensive enterprise solutions over standalone dashboards. SAP's May 2026 launch of sustainability AI agents highlights the market's shift toward automation quality and operational compatibility, reinforcing software's central role despite more stringent buying criteria.
Services are projected to grow at an 19.63% CAGR through 2031, reflecting their strategic importance in addressing the complexities of implementation. Enterprises require support in data preparation, workflow design, and compliance management to maximize platform value, especially when operating across multiple sites or reporting frameworks. This trend benefits vendors combining strong product offerings with effective implementation services, as managed validation, advisory support, and process redesigns enhance customer relationships and renewal rates. Consequently, the market is transitioning from a pure license model to a blended structure where software and services collectively drive value and operational integration.
Carbon accounting remains the backbone of China green IT software market, holding a 32.41% share in 2025. It serves as the foundational layer for emissions tracking, disclosure, and operational analysis, enabling enterprises to establish reliable records before advancing to broader sustainability initiatives. The growing need for consistent data collection, frequent reviews, and standardized reporting has driven vendors to integrate carbon accounting into finance and operations software, enhancing workflow efficiency. While energy management tools and sustainability performance solutions are gaining traction, enterprises often adopt these as complementary layers to carbon accounting, reflecting a modular growth approach. This layered adoption strategy underscores why carbon accounting remains central, even as other solution categories expand.
Sustainability data management platforms are emerging as the fastest-growing segment, with a projected CAGR of 21.26% through 2031. These platforms address the increasing demand for consolidating emissions, energy, water, and social data into a unified framework for enterprise-wide use. Basic carbon tools often fall short in managing complex data relationships required for comprehensive reporting and oversight. By transforming scattered records into a structured reporting backbone, data management platforms are becoming indispensable for enterprises seeking centralized governance of operational data. This trend highlights their critical role in supporting broader sustainability goals within China's green IT software market.
Complete Report Scope:
- By Offering
- Software
- Services
- By Solution Type
- Carbon Accounting and Reporting Software
- Energy Management and Optimization Software
- ESG Data Management Software
- Sustainability Performance Management Software
- Green Data Center Management Software
- By Deployment Mode
- Cloud-Based
- On Premises
- Hybrid
- By Organization Size
- Large Enterprises
- Small and Medium Enterprises
- By End-User Industry
- IT and Telecommunications
- Manufacturing
- Banking, Financial Services, and Insurance (BFSI)
- Government and Public Sector
- Energy and Utilities
- Healthcare and Life Sciences
- Retail and E-Commerce
- Construction and Infrastructure
- Other End-User Industries
List of Companies Covered in this Report:
- IBM Corporation
- Microsoft Corporation
- SAP SE
- Oracle Corporation
- Schneider Electric SE
- Siemens AG
- ABB Ltd.
- Honeywell International Inc.
- Huawei Technologies Co., Ltd.
- Alibaba Group Holding Limited
- Tencent Holdings Limited
- Baidu, Inc.
- Kingdee International Software Group Company Limited
- Yonyou Network Technology Co., Ltd.
- Inspur Group Co., Ltd.
- H3C Technologies Co., Ltd.
- Dell Technologies Inc.
- Hewlett Packard Enterprise Company
- Salesforce, Inc.
- ServiceNow, Inc.
Additional Benefits:
- The market estimate (ME) sheet in Excel format
- 3 months of analyst support
TABLE OF CONTENTS
1 INTRODUCTION
- 1.1 Study Assumptions and Market Definition
- 1.2 Scope of the Study
2 RESEARCH METHODOLOGY
3 EXECUTIVE SUMMARY
4 MARKET LANDSCAPE
- 4.1 Market Overview
- 4.2 Market Drivers
- 4.2.1 Dual-Carbon Policy Momentum and Compliance Digitization
- 4.2.2 Rising Enterprise Demand for Automated Carbon Accounting
- 4.2.3 AI Enabled Energy Optimization Across Data Centers and Industrial IT
- 4.2.4 Expanding ESG Disclosure Requirements Across Export Oriented Firms
- 4.2.5 Growth of Cloud Native Sustainability Platforms for Multi Site Operations
- 4.2.6 Integration of Green IT with Enterprise Resource Planning and Operations Systems
- 4.3 Market Restraints
- 4.3.1 Fragmented Emissions Data and Weak System Interoperability
- 4.3.2 Limited In House Sustainability Data Governance in Small and Medium Enterprises
- 4.3.3 High Implementation Friction for Legacy on Premises Environments
- 4.3.4 Shortage of Standardized Verification and Audit Ready Data Workflows
- 4.4 Industry Value-Chain Analysis
- 4.5 Regulatory Landscape
- 4.6 Technological Outlook
- 4.7 Porter's Five Forces Analysis
- 4.7.1 Bargaining Power of Buyers
- 4.7.2 Bargaining Power of Suppliers
- 4.7.3 Threat of New Entrants
- 4.7.4 Threat of Substitutes
- 4.7.5 Intensity of Competitive Rivalry
- 4.8 Impact of Macroeconomic Factors on the Market
5 MARKET SIZE AND GROWTH FORECASTS (VALUE)
- 5.1 By Offering
- 5.1.1 Software
- 5.1.2 Services
- 5.2 By Solution Type
- 5.2.1 Carbon Accounting and Reporting Software
- 5.2.2 Energy Management and Optimization Software
- 5.2.3 ESG Data Management Software
- 5.2.4 Sustainability Performance Management Software
- 5.2.5 Green Data Center Management Software
- 5.3 By Deployment Mode
- 5.3.1 Cloud-Based
- 5.3.2 On Premises
- 5.3.3 Hybrid
- 5.4 By Organization Size
- 5.4.1 Large Enterprises
- 5.4.2 Small and Medium Enterprises
- 5.5 By End-User Industry
- 5.5.1 IT and Telecommunications
- 5.5.2 Manufacturing
- 5.5.3 Banking, Financial Services, and Insurance (BFSI)
- 5.5.4 Government and Public Sector
- 5.5.5 Energy and Utilities
- 5.5.6 Healthcare and Life Sciences
- 5.5.7 Retail and E-Commerce
- 5.5.8 Construction and Infrastructure
- 5.5.9 Other End-User Industries
6 COMPETITIVE LANDSCAPE
- 6.1 Market Concentration
- 6.2 Strategic Moves
- 6.3 Market Share Analysis
- 6.4 Company Profiles (includes Global Level Overview, Market Level Overview, Core Segments, Financials as available, Strategic Information, Market Rank/Share, Products and Services, Recent Developments)
- 6.4.1 IBM Corporation
- 6.4.2 Microsoft Corporation
- 6.4.3 SAP SE
- 6.4.4 Oracle Corporation
- 6.4.5 Schneider Electric SE
- 6.4.6 Siemens AG
- 6.4.7 ABB Ltd.
- 6.4.8 Honeywell International Inc.
- 6.4.9 Huawei Technologies Co., Ltd.
- 6.4.10 Alibaba Group Holding Limited
- 6.4.11 Tencent Holdings Limited
- 6.4.12 Baidu, Inc.
- 6.4.13 Kingdee International Software Group Company Limited
- 6.4.14 Yonyou Network Technology Co., Ltd.
- 6.4.15 Inspur Group Co., Ltd.
- 6.4.16 H3C Technologies Co., Ltd.
- 6.4.17 Dell Technologies Inc.
- 6.4.18 Hewlett Packard Enterprise Company
- 6.4.19 Salesforce, Inc.
- 6.4.20 ServiceNow, Inc.
7 MARKET OPPORTUNITIES AND FUTURE OUTLOOK
- 7.1 White-Space and Unmet-Need Assessment
- 7.2 Adoption Barriers by Buyer Segment
- 7.3 Product Innovation Roadmap

