PUBLISHER: Mordor Intelligence | PRODUCT CODE: 2073485

PUBLISHER: Mordor Intelligence | PRODUCT CODE: 2073485
Bunker Fuel - Market Share Analysis, Industry Trends & Statistics, Growth Forecasts (2026 - 2031)
According to Mordor Intelligence, the bunker fuel market size in terms of nameplate capacity was valued at 242.12 million tonnes in 2025 and is estimated to grow from 249.65 million tonnes in 2026 to reach 290.12 million tonnes by 2031, at a CAGR of 3.05% during the forecast period (2026-2031).
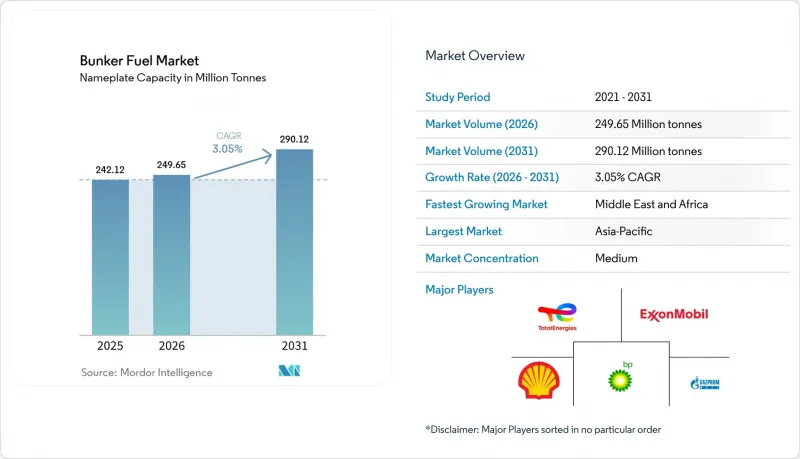
This report is Segmented by Fuel Type (HSFO, VLSFO, ULSFO, MGO, LNG, Methanol, Bio-/Synthetic Fuels, Ammonia, and More), Bunkering Method (Ship-To-Ship, Port-To-Ship, LNG Barge-To-Ship, and Portable Tanks and Containers), Vessel Type (Container, Tanker, Bulk Carrier, General Cargo, Passenger/Ro-Pax, and Offshore and Specialized), and Geography (North America, Europe, Asia-Pacific, South America, and More).
Global Bunker Fuel Market Trends and Insights
IMO 2020 Enforcement & ECA Expansion
Strict sulfur caps that began in 2020 continue to steer fleet owners toward compliant fuels. Detentions for non-compliant sulfur levels rose in Rotterdam and Singapore during 2025, pushing suppliers to install real-time testing at loading points. FuelEU Maritime layers carbon-intensity targets on top of sulfur limits, so operators now juggle VLSFO for short runs, LNG for new-builds, and bio-fuel blends for mid-life tonnage. Classification societies recorded 638 LNG-powered vessels on the water in 2024, with the orderbook pointing to 1,200 units by 2028, confirming that compliance has shifted from simple fuel switching to fleet renewal. ECAs in the Mediterranean and parts of Southeast Asia are widening, which narrows the economic case for high-sulfur grades outside scrubber-equipped fleets. As enforcement tightens, predictable demand for low-sulfur options anchors the bunker fuel market, yet the added carbon layer accelerates diversification toward methanol and ammonia.
Rapid Growth in LNG-Fuelled Fleet Orders
LNG secured around 70% of alternative-fuel vessel contracts placed during 2024, reflecting proven engine reliability and up to 25% lower well-to-wake CO2 emissions versus VLSFO. Hyundai Heavy Industries and China State Shipbuilding Corporation together hold more than 100 LNG-ready container and bulk carrier orders that will deliver between 2026 and 2029. European ferry operators are retrofitting Ro-Pax units to LNG, supported by discounted berthing fees in Norway and Germany that reward lower-emission vessels. Cruise lines mirror the trend; Carnival Corporation's LNG ship orders align with passenger demand for greener itineraries. Engine lead times now stretch to 18 months, prompting owners to secure manufacturing slots ahead of final hull contracts, signaling confidence in LNG despite emerging debate over methane slip.
Tightening Lifecycle-GHG Regulations Beyond CO2
Global rules are shifting from tailpipe carbon to full lifecycle metrics that capture methane slip and upstream emissions. IMO draft guidelines due in 2026 will force owners to disclose methane leakage factors that can neutralize LNG's headline emissions advantage if engines are not high-pressure systems. California's planned Low Carbon Fuel Standard revisions outline similar penalties, putting older dual-fuel engines under cost pressure. Studies peg methane slip between 0.2% and 3.5% depending on engine load, and given methane's 28X global-warming potential, this can materially shift fuel economics. Scrubber discharge bans in Singapore and Fujairah add parallel compliance burdens for HSFO users. The combined effect restrains LNG upside and crimps the bunker fuel market CAGR absent rapid hardware and regulatory evolution.
Other drivers and restraints analyzed in the detailed report include:
- Surging APAC Seaborne Trade Volumes
- Green-Corridor Initiatives Accelerating Ammonia & Methanol Bunkering
- Limited Global LNG Bunkering Infrastructure
For complete list of drivers and restraints, kindly check the Table Of Contents.
Segment Analysis
VLSFO retained 52.4% of global volume in 2025, anchoring the bunker fuel market size at a point where one grade still meets broad compliance without major hardware changes. The fuel's dominance is expected to erode only gradually because many owners hedge price risk through term contracts, limiting exposure to short-term spreads. LNG's 31.6% forecast CAGR signals a second axis of growth that pulls investment into cryogenic storage, dual-fuel engines, and related supply chains. High-Sulfur Fuel Oil (HSFO) remains viable for scrubber-equipped tonnage, but refinery upgrades are shrinking residual output, squeezing discounts that justified scrubber spend.
Methanol and ammonia are moving from pilot to early commercialization as first-mover fleets secure green-corridor routes and subsidized bunkering slots. Bio-fuels and e-fuels are being blended at 5-20% levels, enabling owners to cut lifecycle intensity without engine changes, which shores up short-run demand while larger technology transitions play out. The result is a bifurcated bunker fuel market: legacy fleets maximize VLSFO economics, while strategic new builds lock in LNG or methanol to future-proof against carbon levies.
Complete Report Scope:
- By Fuel Type
- High-Sulfur Fuel Oil (HSFO)
- Very-Low-Sulfur Fuel Oil (VLSFO)
- Ultra-Low-Sulfur Fuel Oil (ULSFO)
- Marine Gas Oil (MGO)
- Liquefied Natural Gas (LNG)
- Methanol
- Bio-/Synthetic Fuels
- Ammonia
- Other Fuel Types
- By Bunkering Method
- Ship-to-Ship
- Port-to-Ship (Truck/Pipeline)
- LNG Barge-to-Ship
- Portable Tanks and Containers
- By Vessel Type
- Container
- Tanker
- Bulk Carrier
- General Cargo
- Passenger/Ro-Pax
- Offshore and Specialized
- By Geography
- North America
- United States
- Canada
- Mexico
- Europe
- Germany
- United Kingdom
- Spain
- Italy
- NORDIC Countries
- Russia
- Rest of Europe
- Asia-Pacific
- China
- India
- Japan
- South Korea
- Singapore
- Indonesia
- Australia
- Rest of Asia-Pacific
- South America
- Brazil
- Argentina
- Chile
- Rest of South America
- Middle East and Africa
- Saudi Arabia
- United Arab Emirates
- Qatar
- South Africa
- Nigeria
- Egypt
- Rest of Middle East and Africa
- North America
Geography Analysis
Asia-Pacific held 44.7% of volume in 2025, reflecting Singapore's 50.6 million-tonne throughput and China's surging port calls. South Korea and Japan expanded LNG offerings for short-sea ferries and trans-Pacific container loops, while Indonesia and Vietnam invested in truck-based VLSFO delivery to back near-shore manufacturing. India's partial cabotage liberalization boosted bunker uplift at Mumbai and Chennai, yet limited low-sulfur storage caps growth.
The Middle East and Africa region is projected to outpace all others at a 3.5% CAGR, anchored by Fujairah's 6.3 million-tonne sales and Saudi Aramco's LNG investments at Red Sea gateways. ADNOC and TotalEnergies added 18,000 m3 of floating LNG storage in early 2026, positioning the Gulf to intercept Asia-Europe flows. Egypt seeks to replicate the model by studying LNG supply points at Port Said and Suez, as 20,600 vessels still used the canal in 2024 despite diversion shocks.
Europe remains defined by strict ECA rules in the Baltic, North Sea, and English Channel. Rotterdam's 9.2 million-tonne throughput and expanded Gate terminal make it the regional hub for both VLSFO and LNG. FuelEU Maritime adds a carbon-intensity levy from 2025 onward, prompting owners to blend bio-fuels or book methanol slots to avoid EUR 2,400 penalties per tonne of CO2 equivalent. North America's Jones Act hurdles inhibit ship-to-ship LNG supply, while South American ports lack cryogenic storage, keeping the bunker fuel market there dependent on conventional grades.
- Exxon Mobil
- Shell plc
- BP plc
- TotalEnergies SE
- Chevron Corp.
- Gazpromneft Marine Bunker
- Lukoil
- Minerva Bunkering
- Peninsula Petroleum
- World Fuel Services
- Bomin Bunker Holding
- GAC Bunker Fuels
- AP Moller-Maersk
- Mediterranean Shipping Co.
- CMA CGM
- COSCO Shipping
- Hapag-Lloyd
- Evergreen Marine
- ONE (Ocean Network Express)
- Yang Ming
- HMM Co.
- Pacific International Lines
Additional Benefits:
- The market estimate (ME) sheet in Excel format
- 3 months of analyst support
TABLE OF CONTENTS
1 Introduction
- 1.1 Study Assumptions & Market Definition
- 1.2 Scope of the Study
2 Research Methodology
3 Executive Summary
4 Market Landscape
- 4.1 Market Overview
- 4.2 Market Drivers
- 4.2.1 IMO 2020 enforcement & ECA expansion
- 4.2.2 Rapid growth in LNG-fuelled fleet orders
- 4.2.3 Surging APAC seaborne trade volumes
- 4.2.4 Scrubber retrofits sustaining HSFO demand
- 4.2.5 Green-corridor initiatives accelerating ammonia & methanol bunkering
- 4.2.6 AI-driven fuel-route optimisation cutting wastage
- 4.3 Market Restraints
- 4.3.1 Tightening lifecycle-GHG regulations beyond CO2
- 4.3.2 Volatile crude spreads disrupting VLSFO pricing
- 4.3.3 Limited global LNG bunkering infrastructure
- 4.3.4 Refinery yield shift reducing residual fuel supply
- 4.4 Supply-Chain Analysis
- 4.5 Regulatory Landscape
- 4.6 Technological Outlook
- 4.7 Porter's Five Forces
- 4.7.1 Bargaining Power of Suppliers
- 4.7.2 Bargaining Power of Consumers
- 4.7.3 Threat of New Entrants
- 4.7.4 Threat of Substitute Products & Services
- 4.7.5 Intensity of Competitive Rivalry
- 4.8 Investment Analysis
5 Market Size & Growth Forecasts
- 5.1 By Fuel Type
- 5.1.1 High-Sulfur Fuel Oil (HSFO)
- 5.1.2 Very-Low-Sulfur Fuel Oil (VLSFO)
- 5.1.3 Ultra-Low-Sulfur Fuel Oil (ULSFO)
- 5.1.4 Marine Gas Oil (MGO)
- 5.1.5 Liquefied Natural Gas (LNG)
- 5.1.6 Methanol
- 5.1.7 Bio-/Synthetic Fuels
- 5.1.8 Ammonia
- 5.1.9 Other Fuel Types
- 5.2 By Bunkering Method
- 5.2.1 Ship-to-Ship
- 5.2.2 Port-to-Ship (Truck/Pipeline)
- 5.2.3 LNG Barge-to-Ship
- 5.2.4 Portable Tanks and Containers
- 5.3 By Vessel Type
- 5.3.1 Container
- 5.3.2 Tanker
- 5.3.3 Bulk Carrier
- 5.3.4 General Cargo
- 5.3.5 Passenger/Ro-Pax
- 5.3.6 Offshore and Specialized
- 5.4 By Geography
- 5.4.1 North America
- 5.4.1.1 United States
- 5.4.1.2 Canada
- 5.4.1.3 Mexico
- 5.4.2 Europe
- 5.4.2.1 Germany
- 5.4.2.2 United Kingdom
- 5.4.2.3 Spain
- 5.4.2.4 Italy
- 5.4.2.5 NORDIC Countries
- 5.4.2.6 Russia
- 5.4.2.7 Rest of Europe
- 5.4.3 Asia-Pacific
- 5.4.3.1 China
- 5.4.3.2 India
- 5.4.3.3 Japan
- 5.4.3.4 South Korea
- 5.4.3.5 Singapore
- 5.4.3.6 Indonesia
- 5.4.3.7 Australia
- 5.4.3.8 Rest of Asia-Pacific
- 5.4.4 South America
- 5.4.4.1 Brazil
- 5.4.4.2 Argentina
- 5.4.4.3 Chile
- 5.4.4.4 Rest of South America
- 5.4.5 Middle East and Africa
- 5.4.5.1 Saudi Arabia
- 5.4.5.2 United Arab Emirates
- 5.4.5.3 Qatar
- 5.4.5.4 South Africa
- 5.4.5.5 Nigeria
- 5.4.5.6 Egypt
- 5.4.5.7 Rest of Middle East and Africa
- 5.4.1 North America
6 Competitive Landscape
- 6.1 Market Concentration
- 6.2 Strategic Moves (M&A, Partnerships, PPAs)
- 6.3 Market Share Analysis (Market Rank/Share for key companies)
- 6.4 Company Profiles (includes Global level Overview, Market level overview, Core Segments, Financials as available, Strategic Information, Products & Services, and Recent Developments)
- 6.4.1 Exxon Mobil
- 6.4.2 Shell plc
- 6.4.3 BP plc
- 6.4.4 TotalEnergies SE
- 6.4.5 Chevron Corp.
- 6.4.6 Gazpromneft Marine Bunker
- 6.4.7 Lukoil
- 6.4.8 Minerva Bunkering
- 6.4.9 Peninsula Petroleum
- 6.4.10 World Fuel Services
- 6.4.11 Bomin Bunker Holding
- 6.4.12 GAC Bunker Fuels
- 6.4.13 AP Moller-Maersk
- 6.4.14 Mediterranean Shipping Co.
- 6.4.15 CMA CGM
- 6.4.16 COSCO Shipping
- 6.4.17 Hapag-Lloyd
- 6.4.18 Evergreen Marine
- 6.4.19 ONE (Ocean Network Express)
- 6.4.20 Yang Ming
- 6.4.21 HMM Co.
- 6.4.22 Pacific International Lines
7 Market Opportunities & Future Outlook
- 7.1 White-space & unmet-need assessment

