PUBLISHER: Mordor Intelligence | PRODUCT CODE: 2073560

PUBLISHER: Mordor Intelligence | PRODUCT CODE: 2073560
South America Bunker Fuel - Market Share Analysis, Industry Trends & Statistics, Growth Forecasts (2026 - 2031)
According to Mordor Intelligence, the south america bunker fuel market size in terms of nameplate capacity is projected to expand from 15.25 million tons in 2025 and 15.71 million tons in 2026 to 18.18 million tons by 2031, registering a CAGR of 2.96% between 2026 to 2031.
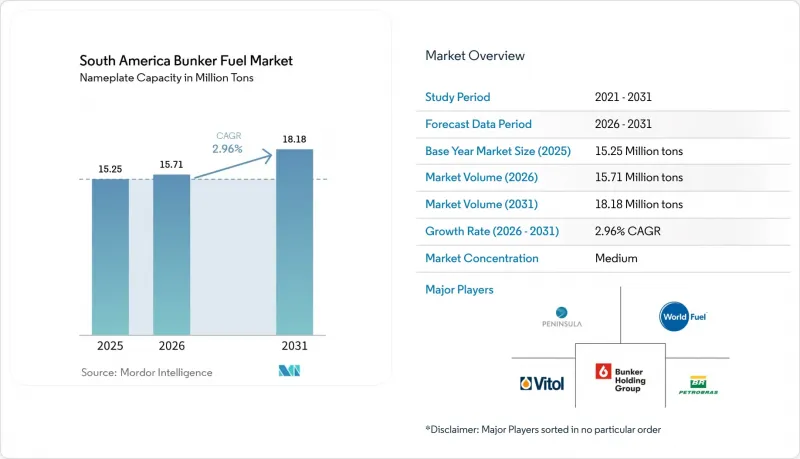
This report is Segmented by Fuel Type (HSFO, VLSFO, ULSFO, MGO, LNG, Methanol, Bio-/Synthetic Fuels, Ammonia, and More), Bunkering Method (Ship-To-Ship, Port-To-Ship, LNG Barge-To-Ship, and Portable Tanks and Containers), Vessel Type (Container, Tanker, Bulk Carrier, General Cargo, Passenger/Ro-Pax, and Offshore and Specialized), and Geography (Brazil, Argentina, Chile, and Rest of South America).
South America Bunker Fuel Market Trends and Insights
Rising Marine Transportation Of Essential Commodities In South America
Exports of soybeans, corn, iron ore, copper, and lithium continue to lift voyage counts and sustain bunker demand across major Atlantic and Pacific ports. Brazil shipped 102 million tons of soybeans and 55 million tons of corn in 2024, while Vale moved 380 million tons of iron ore primarily to China. Chile exported 5.5 million tonnes of copper and 180,000 tons of lithium carbonate, feeding steady bunker liftings at Valparaiso, San Antonio, and Quintero. Argentina's Vaca Muerta pipeline project will allow very large crude carriers to load by 2027, creating additional uplift demand at Punta Colorada. Commodity flows remain resilient because longer transit times offset slow-steaming fuel savings. Infrastructure expansions scheduled through 2028 will cement this medium-term influence on the South America bunker fuel market.
Supportive IMO-2020 Compliant Fuel-Switching Incentives And Local Sulfur-Tax Breaks
Regulators introduced cost-relief mechanisms that reward vessels burning lower-sulfur fuels. Brazil's National Waterway Transport Agency waives port-fee surcharges for fuels at or below 0.10% sulfur, and Argentina's Prefectura Naval grants dockage-fee reductions for ISO 8217-compliant deliveries. Chile aligned with IMO 2020 requirements in 2025, accelerating the shift from 3.5% sulfur HSFO to VLSFO and MGO. These measures prompt shipowners to retrofit scrubbers or switch to compliant fuels within the next two years. They also establish a precedent for differentiated port charges tied to carbon intensity, likely supporting emerging LNG and methanol supply chains.
Persistent Crude-Price Volatility Impacting Bunker Price Stability
Brent crude oscillated between USD 70 and USD 90 per barrel during 2025, driving 15-20% monthly swings in VLSFO and HSFO prices at Santos and Buenos Aires. Shipowners on fixed freight contracts experience margin pressure and often defer bunkering when local premiums exceed USD 30 per ton relative to benchmark hubs. Only 22% of South American volumes moved under quarterly fixed-price deals in 2025, far below Singapore's 45% share, which forces traders to hold larger working-capital buffers. Limited derivative liquidity, South America accounts for less than 2% of global marine-fuel swaps, hampers risk-management options.
Other drivers and restraints analyzed in the detailed report include:
- Accelerating Pre-Salt Crude Exports Boosting Demand At Brazilian And Uruguayan Hubs
- Rapid Port-Call Growth On Asia-South America Container Loops
- Delayed LNG Bunkering Infrastructure Build-Out Across Atlantic And Pacific Coasts
For complete list of drivers and restraints, kindly check the Table Of Contents.
Segment Analysis
High-sulfur fuel oil retained 43.8% of the South America bunker fuel market share in 2025, supported by a large fleet of scrubber-equipped tankers and bulk carriers that can legally consume 3.5% sulfur fuel. LNG volumes, though smaller, are projecting a 13.3% CAGR that will steadily erode HSFO share as more dual-fuel vessels enter service. VLSFO serves container and general-cargo vessels that have not installed exhaust-gas-cleaning systems, while MGO fills niche auxiliary-engine demand where fuel-quality thresholds are strict. Methanol, ammonia, and synthetic fuels remain embryonic because engines and handling infrastructure are limited, yet multiple liner operators have placed methanol-capable vessels on order for post-2027 deployment. Bio-bunkers occupied roughly 1.2% of 2025 volumes and hinge on feedstock economics; cost parity with MGO will determine whether the category scales beyond early-adopter volumes.
The South America bunker fuel market size attributable to LNG could rise from 950,000 tons in 2025 to more than 2 million tons by 2031 if shore-side infrastructure reaches the planned twelve terminals. Delivered LNG in Santos averaged USD 14 per MMBtu in 2025, which equates to a 12-15% fuel-cost saving versus VLSFO on an energy-equivalent basis, although capital amortization for dual-fuel engines narrows the margin over a 20-year horizon. ULSFO retains a niche role for vessels entering emission-control areas outside the region, but limited South American demand keeps blended supply tight. The South America bunker fuel market continues to balance cost, compliance, and infrastructure maturity when allocating bunker-fuel budgets across HSFO, VLSFO, LNG, and emerging alternatives.
Complete Report Scope:
- By Fuel Type
- High-Sulfur Fuel Oil (HSFO)
- Very-Low-Sulfur Fuel Oil (VLSFO)
- Ultra-Low-Sulfur Fuel Oil (ULSFO)
- Marine Gas Oil (MGO)
- Liquefied Natural Gas (LNG)
- Methanol
- Bio-/Synthetic Fuels
- Ammonia
- Other Fuel Types
- By Bunkering Method
- Ship-to-Ship
- Port-to-Ship (Truck/Pipeline)
- LNG Barge-to-Ship
- Portable Tanks and Containers
- By Vessel Type
- Container
- Tanker
- Bulk Carrier
- General Cargo
- Passenger/Ro-Pax
- Offshore and Specialized
- By Geography
- Brazil
- Argentina
- Chile
- Rest of South America
List of Companies Covered in this Report:
- Vitol Holding BV
- Monjasa Holding A/S
- Bunker Holding A/S
- World Fuel Services Corp
- Peninsula Petroleum Ltd
- TotalEnergies SE
- Chevron Corp
- Petrobras
- Integr8 Fuels
- Trafigura Group Pte
- Aegean Marine Petroleum
- Repsol SA
- ExxonMobil Corp
- Bomin Bunker Oil Corp
- PetroEcuador
- YPF SA
- AP Moller-Maersk A/S
- Mediterranean Shipping Company SA
- CMA CGM Group
- China COSCO Shipping
- Hapag-Lloyd AG
- Ocean Network Express
Additional Benefits:
- The market estimate (ME) sheet in Excel format
- 3 months of analyst support
TABLE OF CONTENTS
1 Introduction
- 1.1 Study Assumptions & Market Definition
- 1.2 Scope of the Study
2 Research Methodology
3 Executive Summary
4 Market Landscape
- 4.1 Market Overview
- 4.2 Market Drivers
- 4.2.1 Rising marine transportation of essential commodities in South America
- 4.2.2 Supportive IMO-2020-compliant fuel-switching incentives & local sulfur-tax breaks
- 4.2.3 Accelerating pre-salt crude exports driving bunkering demand at Brazilian & Uruguayan hubs
- 4.2.4 Rapid port-call growth on Asia-South America container loops post-Panama Canal expansions
- 4.2.5 Petrobras refinery divestments unlocking third-party physical supply and price competition
- 4.2.6 Pilot-scale bio-bunker (B24-B30) certification creating first-mover advantage for low-carbon blends
- 4.3 Market Restraints
- 4.3.1 Persistent crude-price volatility impacting bunker price stability
- 4.3.2 Delayed LNG bunkering infrastructure build-out across Atlantic & Pacific coasts
- 4.3.3 Quality-control issues: VLSFO/HSFO off-spec rates >5.9 % in region
- 4.3.4 Feedstock competition inflating bio-bunker input costs (soy oil, methanol)
- 4.4 Supply-Chain Analysis
- 4.5 Regulatory Landscape
- 4.6 Technological Outlook
- 4.7 Porter's Five Forces
- 4.7.1 Bargaining Power of Suppliers
- 4.7.2 Bargaining Power of Consumers
- 4.7.3 Threat of New Entrants
- 4.7.4 Threat of Substitutes
- 4.7.5 Intensity of Competitive Rivalry
5 Market Size & Growth Forecasts
- 5.1 By Fuel Type
- 5.1.1 High-Sulfur Fuel Oil (HSFO)
- 5.1.2 Very-Low-Sulfur Fuel Oil (VLSFO)
- 5.1.3 Ultra-Low-Sulfur Fuel Oil (ULSFO)
- 5.1.4 Marine Gas Oil (MGO)
- 5.1.5 Liquefied Natural Gas (LNG)
- 5.1.6 Methanol
- 5.1.7 Bio-/Synthetic Fuels
- 5.1.8 Ammonia
- 5.1.9 Other Fuel Types
- 5.2 By Bunkering Method
- 5.2.1 Ship-to-Ship
- 5.2.2 Port-to-Ship (Truck/Pipeline)
- 5.2.3 LNG Barge-to-Ship
- 5.2.4 Portable Tanks and Containers
- 5.3 By Vessel Type
- 5.3.1 Container
- 5.3.2 Tanker
- 5.3.3 Bulk Carrier
- 5.3.4 General Cargo
- 5.3.5 Passenger/Ro-Pax
- 5.3.6 Offshore and Specialized
- 5.4 By Geography
- 5.4.1 Brazil
- 5.4.2 Argentina
- 5.4.3 Chile
- 5.4.4 Rest of South America
6 Competitive Landscape
- 6.1 Market Concentration
- 6.2 Strategic Moves (M&A, Partnerships, PPAs)
- 6.3 Market Share Analysis (Market Rank/Share for key companies)
- 6.4 Company Profiles (includes Global level Overview, Market level overview, Core Segments, Financials as available, Strategic Information, Products & Services, and Recent Developments)
- 6.4.1 Vitol Holding BV
- 6.4.2 Monjasa Holding A/S
- 6.4.3 Bunker Holding A/S
- 6.4.4 World Fuel Services Corp
- 6.4.5 Peninsula Petroleum Ltd
- 6.4.6 TotalEnergies SE
- 6.4.7 Chevron Corp
- 6.4.8 Petrobras
- 6.4.9 Integr8 Fuels
- 6.4.10 Trafigura Group Pte
- 6.4.11 Aegean Marine Petroleum
- 6.4.12 Repsol SA
- 6.4.13 ExxonMobil Corp
- 6.4.14 Bomin Bunker Oil Corp
- 6.4.15 PetroEcuador
- 6.4.16 YPF SA
- 6.4.17 AP Moller-Maersk A/S
- 6.4.18 Mediterranean Shipping Company SA
- 6.4.19 CMA CGM Group
- 6.4.20 China COSCO Shipping
- 6.4.21 Hapag-Lloyd AG
- 6.4.22 Ocean Network Express
7 Market Opportunities & Future Outlook
- 7.1 White-space & Unmet-Need Assessment

