PUBLISHER: Mordor Intelligence | PRODUCT CODE: 2073625

PUBLISHER: Mordor Intelligence | PRODUCT CODE: 2073625
North America Van - Market Share Analysis, Industry Trends & Statistics, Growth Forecasts (2026 - 2031)
According to Mordor Intelligence, the north american van market was valued at USD 49.94 billion in 2025 and estimated to grow from USD 51.89 billion in 2026 to reach USD 62.83 billion by 2031, at a CAGR of 3.90% during the forecast period (2026-2031).
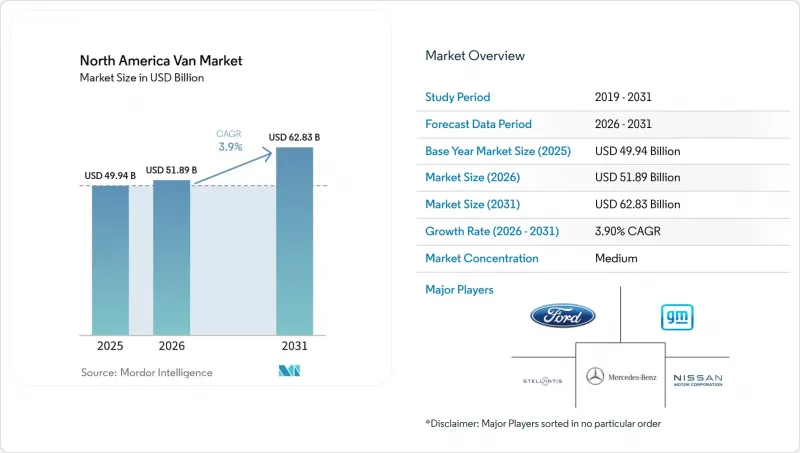
This report is Segmented by Propulsion Type (Hybrid and Electric Vehicles, Internal Combustion Engine), Vehicle Type (Cargo Van, Passenger Van, and More), End-User (Last-Mile Delivery and Parcel, Field Services and Utilities, and More), Tonnage Capacity (Up To 2 Tons, 2-3 Tons, and More), Battery Range, and Country. The Market Forecasts are Provided in Terms of Value (USD) and Volume (Units).
North America Van Market Trends and Insights
Parcel E-commerce Boom and Last-Mile Surge
In 2024, the United States experienced significant growth in e-commerce parcel shipments. This increase has tightened delivery windows, prompting operators to utilize smaller vans adept at navigating residential streets while maximizing payload capacity. Amazon's pledge to field 100,000 Rivian vans by 2030 created a blueprint for electrified capacity reservations. FedEx and UPS have echoed this sentiment with their own multi-year orders, yet the challenge of grid-ready depots persists. According to the National Renewable Energy Laboratory, electrifying a portion of urban delivery vans would require a considerable increase in charging load, comparable to the output of multiple utility-scale plants. In response to demand-charge risks, fleets are strategically co-locating solar and storage solutions. This transformation of depots into microgrids not only reduces peak tariffs but also unlocks potential revenue from ancillary services.
IRA-Backed Domestic EV and Battery Investments
The Inflation Reduction Act provides up to USD 40,000 per qualifying heavy-duty commercial vehicle, so long as final assembly and key battery content are North America-based . In the inaugural year following the enactment, a significant majority of eligible units capitalized on the full credit, underscoring its importance in the total-cost-of-ownership equation. This incentive surge catalyzed numerous battery-related announcements, notably featuring LG-Honda's joint venture in Ohio and Panasonic's expansion in Kansas. By shortening logistics routes and sourcing cells locally, domestic OEMs have reduced the order-to-delivery timeline, gaining a competitive speed advantage as compliance benchmarks escalate through the coming years.
Fast-Charger Demand-Charge Spikes
During peak months, commercial tariffs often impose significant demand fees. A depot with multiple vans utilizing high-capacity chargers could face substantial monthly demand charges. This erodes fuel savings and extends the electric vehicle (EV) payback period beyond the typical replacement timeframe. Managed-charging program enrollment remains inconsistent, with only a small portion of eligible commercial clients participating. This has forced fleets to invest in costly on-site batteries as load buffers. Meanwhile, legislative remedies like California's AB 2061 remain stalled, leaving operators to navigate tariff complexities independently.
Other drivers and restraints analyzed in the detailed report include:
- Sub-USD 100 kWh Battery Packs by 2027
- State-Level ZEV and Fleet Mandates
- Up-Front BEV Van Price Premium
For complete list of drivers and restraints, kindly check the Table Of Contents.
Segment Analysis
Internal-combustion drivetrains retained 73.45% of 2025 volumes, but electric and hybrid formats are pacing the North America van market at an 8.25% CAGR, double headline growth. Battery-electric vans dominate the electrified delivery segment, with improving range-per-dollar metrics driving a preference for BEVs over plug-in hybrids. The North American market for BEV vans is expected to grow significantly, supported by the current incentive framework. Although fuel-cell pilot fleets remain small in scale, they show promise for long-range applications, particularly as green hydrogen costs decrease in line with national initiatives.
Internal combustion engines are shifting toward gasoline and CNG options in lighter vehicle classes, while diesel continues to be favored in heavier categories due to its torque and refueling speed advantages. However, advancements in energy density are reducing diesel's payload superiority. This development indicates a potential turning point in the market as solid-state chemistries begin to see limited commercial adoption.
Cargo configurations occupied 64.01% of deliveries in 2025, mirroring last-mile dominance. Specialty vans-refrigerated, camper, and ambulance builds-are, however, posting the quickest uptake at a 6.24% CAGR to 2031. Electric transport-refrigeration units from Carrier and Thermo King draw propulsion energy or tap auxiliary packs, slicing payload yet helping shippers meet anti-idling rules in California and New York . Camper conversions are now a fully factory option on Mercedes-Benz's eSprinter, reflecting the lifestyle segment's willingness to pay premiums for silent off-grid operation.
Yet, specialty electrification faces unresolved weight-range trade-offs. Ambulance upfitters must certify high-voltage medical systems in the absence of a dedicated NFPA standard, lengthening approval cycles and tempering volume. OEMs that invest early in application-specific integrations stand to capture above-average margins in these regulated, high-value niches.
Complete Report Scope:
- By Propulsion Type
- Hybrid and Electric Vehicles
- Battery Electric Vehicle (BEV)
- Plug-in Hybrid Electric Vehicle (PHEV)
- Hybrid Electric Vehicle (HEV)
- Fuel-Cell Electric Vehicle (FCEV)
- Internal Combustion Engine (ICE)
- Diesel
- Gasoline
- CNG and Others
- Hybrid and Electric Vehicles
- By Vehicle Type
- Cargo Van
- Passenger Van
- Specialty Van (Refrigerated, Camper, Ambulance)
- By End-User
- Last-Mile Delivery and Parcel
- Field Services and Utilities
- Rental and Leasing Fleets
- Recreational and Van-Life
- Government and Municipal Fleets
- Corporate Passenger Transport
- By Tonnage Capacity
- Up to 2 Tons
- 2-3 Tons
- 3- 5.5 Tons
- Above 5.5 Tons
- By Battery Range
- Up to 100 miles
- 100-200 miles
- Above 200 miles
- By Country
- United States
- Canada
- Mexico
List of Companies Covered in this Report:
- Mercedes-Benz Group AG
- Ford Motor Company
- General Motors Company
- Stellantis N.V.
- Nissan Motor Co., Ltd.
- Toyota Motor Corporation
- Volkswagen AG
- Rivian Automotive Inc.
- Workhorse Group Inc.
- Kia Corporation
- Isuzu Motors Ltd.
- Hino Motors Ltd.
- SAIC Motor Corp., Ltd.
Additional Benefits:
- The market estimate (ME) sheet in Excel format
- 3 months of analyst support
TABLE OF CONTENTS
1 Introduction
- 1.1 Study Assumptions & Market Definition
- 1.2 Scope of the Study
2 Research Methodology
3 Executive Summary
4 Key Industry Trends
- 4.1 Urbanization, Population & Vehicle/Transit Demand
- 4.2 EV Penetration in Van Market
- 4.3 Fuel vs Electricity Price Spread (per km)
- 4.4 EV vs ICE Total Cost of Ownership Gap
- 4.5 Financing & Ownership Models (Loan, Lease, Subscription)
- 4.6 Battery Chemistry Mix & Pack Energy Density
- 4.7 Home, Workplace & Public Charger Density
- 4.8 Fast-Charging Network Coverage & Power Bands
- 4.9 Alternative Fuels Infrastructure (Hydrogen for FCEVs)
- 4.10 Subsidy & Consumer-Incentive Value
- 4.11 OEM EV Line-up & Model Pipeline
- 4.12 Value-Chain & Distribution-Channel Analysis
- 4.13 Regulatory, Fiscal & Industrial Policy Framework
5 Market Landscape
- 5.1 Market Overview
- 5.2 Market Drivers
- 5.2.1 Parcel E-commerce Boom and Last-Mile Surge
- 5.2.2 IRA-Backed Domestic EV and Battery Investments
- 5.2.3 Sub-USD 100 kWh Battery Packs by 2027
- 5.2.4 State-Level ZEV and Fleet Mandates
- 5.2.5 Skateboard Van Platforms Cut CAPEX 30%
- 5.2.6 Smart-Depot V2G Revenue Stacking
- 5.3 Market Restraints
- 5.3.1 Fast-Charger Demand-Charge Spikes
- 5.3.2 Up-Front BEV Van Price Premium
- 5.3.3 E-Powertrain Service-Tech Shortage
- 5.3.4 Battery Weight Pushes Above 4.5 t GVWR
- 5.4 Value / Supply-Chain Analysis
- 5.5 Regulatory Landscape
- 5.6 Technological Outlook
- 5.7 Porter's Five Forces
- 5.7.1 Threat of New Entrants
- 5.7.2 Bargaining Power of Suppliers
- 5.7.3 Bargaining Power of Buyers
- 5.7.4 Threat of Substitutes
- 5.7.5 Industry Rivalry
6 Market Size & Growth Forecasts (Value (USD) and Volume (Units))
- 6.1 By Propulsion Type
- 6.1.1 Hybrid and Electric Vehicles
- 6.1.1.1 Battery Electric Vehicle (BEV)
- 6.1.1.2 Plug-in Hybrid Electric Vehicle (PHEV)
- 6.1.1.3 Hybrid Electric Vehicle (HEV)
- 6.1.1.4 Fuel-Cell Electric Vehicle (FCEV)
- 6.1.2 Internal Combustion Engine (ICE)
- 6.1.2.1 Diesel
- 6.1.2.2 Gasoline
- 6.1.2.3 CNG and Others
- 6.1.1 Hybrid and Electric Vehicles
- 6.2 By Vehicle Type
- 6.2.1 Cargo Van
- 6.2.2 Passenger Van
- 6.2.3 Specialty Van (Refrigerated, Camper, Ambulance)
- 6.3 By End-User
- 6.3.1 Last-Mile Delivery and Parcel
- 6.3.2 Field Services and Utilities
- 6.3.3 Rental and Leasing Fleets
- 6.3.4 Recreational and Van-Life
- 6.3.5 Government and Municipal Fleets
- 6.3.6 Corporate Passenger Transport
- 6.4 By Tonnage Capacity
- 6.4.1 Up to 2 Tons
- 6.4.2 2-3 Tons
- 6.4.3 3- 5.5 Tons
- 6.4.4 Above 5.5 Tons
- 6.5 By Battery Range
- 6.5.1 Up to 100 miles
- 6.5.2 100-200 miles
- 6.5.3 Above 200 miles
- 6.6 By Country
- 6.6.1 United States
- 6.6.2 Canada
- 6.6.3 Mexico
7 Competitive Landscape
- 7.1 Market Concentration
- 7.2 Strategic Moves
- 7.3 Market Share Analysis
- 7.4 Company Profiles (includes Global Level Overview, Market Level Overview, Core Segments, Financials as Available, Strategic Information, Market Rank/Share for Key Companies, Products and Services, SWOT Analysis, and Recent Developments)
- 7.4.1 Mercedes-Benz Group AG
- 7.4.2 Ford Motor Company
- 7.4.3 General Motors Company
- 7.4.4 Stellantis N.V.
- 7.4.5 Nissan Motor Co., Ltd.
- 7.4.6 Toyota Motor Corporation
- 7.4.7 Volkswagen AG
- 7.4.8 Rivian Automotive Inc.
- 7.4.9 Workhorse Group Inc.
- 7.4.10 Kia Corporation
- 7.4.11 Isuzu Motors Ltd.
- 7.4.12 Hino Motors Ltd.
- 7.4.13 SAIC Motor Corp., Ltd.
8 Market Opportunities & Future Outlook
9 Key Strategic Questions for CEOs

