PUBLISHER: Mordor Intelligence | PRODUCT CODE: 2100556

PUBLISHER: Mordor Intelligence | PRODUCT CODE: 2100556
India Wind Energy - Market Share Analysis, Industry Trends & Statistics, Growth Forecasts (2026 - 2031)
According to Mordor Intelligence, the India wind energy market size in terms of installed base is projected to be 53.25 gigawatt in 2025, 59.5 gigawatt in 2026, and reach 119.5 gigawatt by 2031, growing at a CAGR of 14.97% from 2026 to 2031.
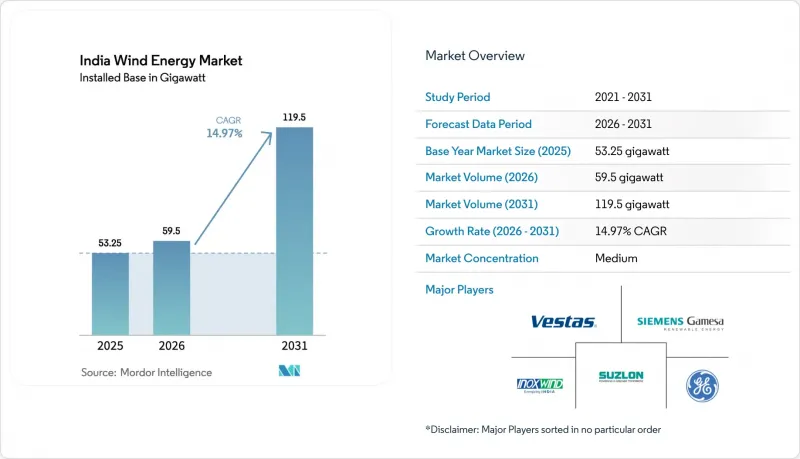
This report is Segmented by Location (Onshore and Offshore), Turbine Capacity (Up To 3 MW, 3 To 6 MW, and Above 6 MW), and Application (Utility-Scale, Commercial and Industrial, and Community Projects). The Market Sizes and Forecasts are Provided in Terms of Installed Capacity (GW).
India Wind Energy Market Trends and Insights
Hybrid Renewable Auctions Accelerate Capacity Utilization
Hybrid tenders awarded 1,200 MW in Tamil Nadu and Gujarat in fiscal 2025, strengthening the India wind energy market by lifting combined plant-load factors above 35% and permitting developers to secure debt at 9.5% interest, 150 basis points below standalone wind benchmarks. The Solar Energy Corporation of India's eighth ISTS hybrid tranche cleared at tariffs between Rs 2.99 and Rs 3.04 per kWh (USD 0.036-0.037 per kWh), confirming that colocating wind and solar slashes balancing-of-system costs. Tamil Nadu's 34.75 MW repowering-to-hybrid pilot doubled annual generation by replacing fifteen 1.5 MW turbines with five 3 MW machines paired with 10 MW of solar on the same site. Gujarat's Kutch region benefits further because nocturnal wind peaks dovetail with strong daytime solar irradiation, which averages 5.5 kWh/m2/day, reducing curtailment risk. Moreover, hybrid structures sidestep state-level energy-banking caps that typically force generators to curtail during monsoon months, protecting revenue streams.
Viability-Gap Funding Unlocks Offshore Supply Chains
The Ministry of New and Renewable Energy earmarked Rs 6,853 crore (USD 820 million) to de-risk the first 1 GW of offshore capacity, split evenly between Gujarat's Gulf of Khambhat and Tamil Nadu's Gulf of Mannar, by fixing tariffs at Rs 4.5 per kWh (USD 0.054 per kWh). This subsidy persuaded Siemens Gamesa and Vestas to announce new blade and nacelle factories in Gujarat aimed at a 4 GW tender pipeline through 2028. Seabed surveys by the National Institute of Wind Energy indicate 70 GW of technical potential in 30 m-60 m depths, but evacuation remains critical. Power Grid Corporation of India is designing a 2,000 MW HVDC link from the Gulf of Khambhat to Saurashtra, yet land acquisition for converter stations delays commissioning until late 2027. Without that corridor, the 500 MW Gujarat pilot cannot reach financial close even though developers already hold seabed leases, underscoring the grid's gatekeeper role.
Land Allotment Constraints in Karnataka and Maharashtra
Karnataka and Maharashtra contributed 2.1 GW of 2024 installations, but the India wind energy market now faces forest-clearance backlogs that extend project schedules by 18-24 months. Karnataka's Forest Department demands compensatory afforestation at double the diverted acreage, inflating per-megawatt land cost by up to Rs 10 lakh (USD 12,000). Maharashtra halted approvals in five talukas of Satara after title disputes with tribal communities froze roughly 800 MW of capacity. Developers pivot to Rajasthan and Gujarat, but lower wind speeds of 6.5 m/s at a 100 m hub height shave capacity-utilization factors by 8-10% compared with Karnataka's 7.2 m/s profile. Repowering projects also stall because contiguous plots large enough for 140 m rotors are fragmented across multiple smallholders, elevating transaction complexity.
Other drivers and restraints analyzed in the detailed report include:
- Repowering Scheme Targets 5 GW-15 GW of Ageing Assets
- Green Hydrogen Policy Drives Industrial Wind Demand
- Grid Evacuation Delays for Offshore Wind
For complete list of drivers and restraints, kindly check the Table Of Contents.
Segment Analysis
Onshore capacity accounted for the entire India wind energy market in 2025, expanding by 3.4 GW that year and heading toward a 14.9% CAGR through 2031, underpinned by robust state PPA demand. Gujarat led 2024 installations with 1,250 MW, followed by Karnataka at 1,135 MW and Tamil Nadu at 980 MW, as these states maintained clear land and grid processes. Offshore contributes none of the installed base today, yet a 1 GW funded pilot, 500 MW each in Gujarat and Tamil Nadu, targets commissioning by 2028 once the Power Grid evacuation link activates. National seabed surveys suggest 70 GW of technical potential at moderate depths.
Domestic OEMs dominate the onshore supply chain from blade fabrication in Gujarat to nacelle assembly in Himachal Pradesh, enabling six-month delivery cycles. Projects in Rajasthan and Andhra Pradesh now serve dedicated green-hydrogen complexes, pairing 2,400 MW of wind with solar and storage to guarantee 70% annual availability, further supporting the India wind energy market. Offshore's higher capacity factors, 45-50% compared with 25-30% onshore, could unlock premium tariffs once grid bottlenecks clear, but developers remain wary of the 40% capex premium and limited installation vessel availability. Consequently, most capital will continue to favor onshore repowering and hybrid assets until 2027.
Complete Report Scope:
- By Location
- Onshore
- Offshore
- By Turbine Capacity
- Up to 3 MW
- 3 to 6 MW
- Above 6 MW
- By Application
- Utility-scale
- Commercial and Industrial
- Community Projects
- By Component (Qualitative Analysis)
- Nacelle/Turbine
- Blade
- Tower
- Generator and Gearbox
- Balance-of-System
List of Companies Covered in this Report:
- Inox Wind Limited
- Suzlon Energy Limited
- Siemens Gamesa Renewable Energy SA
- Vestas Wind Systems A/S
- General Electric Company
- Envision Energy
- Wind World (India) Ltd
- Tata Power Renewable Energy Ltd
- Enercon GmbH
- Senvion India
- ReNew Power (ReNew Energy Global PLC)
- Adani Green Energy Ltd
- JSW Energy - Mytrah Cluster
- Amp Energy India Pvt Ltd
- Greenko Group
- Siemens Energy AG
- Mingyang Smart Energy
- Nordex SE
- Leitwind Shriram Manufacturing Ltd
- GE T&D India Ltd
- SKF India
- Hitachi Energy India Ltd
- Bharat Heavy Electricals Ltd
- LM Wind Power (India)
Additional Benefits:
- The market estimate (ME) sheet in Excel format
- 3 months of analyst support
TABLE OF CONTENTS
1 Introduction
- 1.1 Study Assumptions & Market Definition
- 1.2 Scope of the Study
2 Research Methodology
3 Executive Summary
4 Market Landscape
- 4.1 Market Overview
- 4.2 Market Drivers
- 4.2.1 Accelerated Hybrid Renewable Auctions Bundling Wind with Solar Enhancing Capacity Utilisation in Tamil Nadu & Gujarat
- 4.2.2 Viability-Gap Funding for Initial 4 GW Offshore Wind Round in Gujarat Catalyst for Supply-Chain Investments
- 4.2.3 Repowering Scheme Opening 5-15 GW of Ageing Wind Farms for High-Capacity Turbines
- 4.2.4 Green Hydrogen Policy Driving Demand for High-Load-Factor Wind Power in Industrial Clusters
- 4.2.5 ISTS Charge Waivers Boosting Wind Project IRRs in Resource-Rich Western States
- 4.2.6 Corporate PPAs Surge from Data-centre Operators Seeking RTC Wind-Solar Mix
- 4.3 Market Restraints
- 4.3.1 Land Allotment Freeze in Karnataka & Maharashtra Slowing Onshore Pipeline
- 4.3.2 Delayed Grid Evacuation Corridors for Offshore Wind at Gulf of Khambhat
- 4.3.3 Rising GST on Turbine Components Eroding Cost Competitiveness vs Solar
- 4.3.4 Banking Restrictions (above 30% Energy) by State DISCOMs Increasing Curtailment Risk
- 4.4 Supply-Chain Analysis
- 4.5 Regulatory Outlook
- 4.6 Technological Outlook
- 4.7 Porter's Five Forces
- 4.7.1 Bargaining Power of Suppliers
- 4.7.2 Bargaining Power of Buyers
- 4.7.3 Threat of New Entrants
- 4.7.4 Threat of Substitutes
- 4.7.5 Competitive Rivalry
- 4.8 PESTLE Analysis
5 Market Size & Growth Forecasts
- 5.1 By Location
- 5.1.1 Onshore
- 5.1.2 Offshore
- 5.2 By Turbine Capacity
- 5.2.1 Up to 3 MW
- 5.2.2 3 to 6 MW
- 5.2.3 Above 6 MW
- 5.3 By Application
- 5.3.1 Utility-scale
- 5.3.2 Commercial and Industrial
- 5.3.3 Community Projects
- 5.4 By Component (Qualitative Analysis)
- 5.4.1 Nacelle/Turbine
- 5.4.2 Blade
- 5.4.3 Tower
- 5.4.4 Generator and Gearbox
- 5.4.5 Balance-of-System
6 Competitive Landscape
- 6.1 Market Concentration
- 6.2 Strategic Moves (M&A, Partnerships, PPAs)
- 6.3 Market Share Analysis (Market Rank/Share for key companies)
- 6.4 Company Profiles (includes Global level Overview, Market level overview, Core Segments, Financials as available, Strategic Information, Products & Services, and Recent Developments)
- 6.4.1 Inox Wind Limited
- 6.4.2 Suzlon Energy Limited
- 6.4.3 Siemens Gamesa Renewable Energy SA
- 6.4.4 Vestas Wind Systems A/S
- 6.4.5 General Electric Company
- 6.4.6 Envision Energy
- 6.4.7 Wind World (India) Ltd
- 6.4.8 Tata Power Renewable Energy Ltd
- 6.4.9 Enercon GmbH
- 6.4.10 Senvion India
- 6.4.11 ReNew Power (ReNew Energy Global PLC)
- 6.4.12 Adani Green Energy Ltd
- 6.4.13 JSW Energy - Mytrah Cluster
- 6.4.14 Amp Energy India Pvt Ltd
- 6.4.15 Greenko Group
- 6.4.16 Siemens Energy AG
- 6.4.17 Mingyang Smart Energy
- 6.4.18 Nordex SE
- 6.4.19 Leitwind Shriram Manufacturing Ltd
- 6.4.20 GE T&D India Ltd
- 6.4.21 SKF India
- 6.4.22 Hitachi Energy India Ltd
- 6.4.23 Bharat Heavy Electricals Ltd
- 6.4.24 LM Wind Power (India)
7 Market Opportunities & Future Outlook
- 7.1 White-space & Unmet-Need Assessment

