PUBLISHER: Mordor Intelligence | PRODUCT CODE: 2121610

PUBLISHER: Mordor Intelligence | PRODUCT CODE: 2121610
Italy Wind Energy - Market Share Analysis, Industry Trends & Statistics, Growth Forecasts (2026 - 2031)
According to Mordor Intelligence, the Italy wind energy market size in terms of installed base is expected to grow from 13.33 gigawatt in 2025 to 13.73 gigawatt in 2026 and is forecast to reach 15.94 gigawatt by 2031 at 3.02% CAGR over 2026-2031.
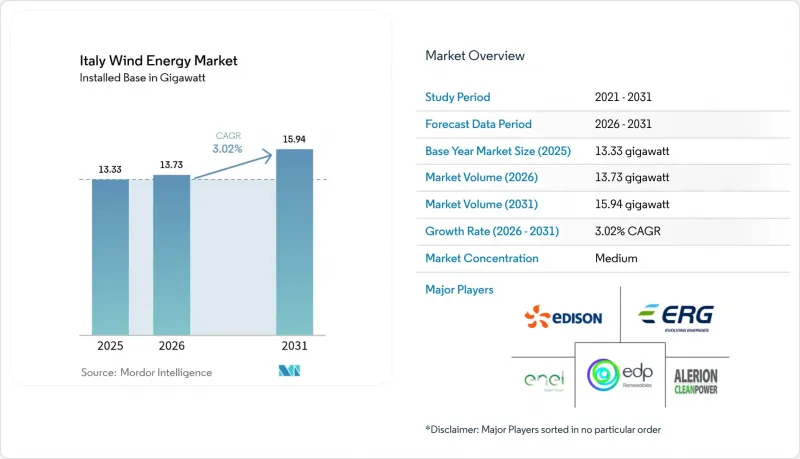
This report is Segmented by Location (Onshore and Offshore), Turbine Capacity (Less Than 3 MW, 3 To 6 MW, and Above 6 MW), and Application (Utility-Scale, Commercial and Industrial, and Community Projects). The Market Size and Forecasts are Provided in Terms of Installed Capacity (GW).
Italy Wind Energy Market Trends and Insights
Renewable-energy auction pipeline expansion
Italy's FER2 decree establishes two-way CfDs with a EUR 185/MWh (USD 199.8/MWh) strike price for offshore wind, eliminating merchant revenue uncertainty and facilitating project debt financing. The European Commission approved a EUR 35.5 billion (USD 38.3 billion) scheme spanning 2028 that encompasses 4.59 GW of new renewable capacity, including gigawatt-scale floating projects in the Adriatic and Ionian Seas. Environmental approvals for Agnes-1-2 (700 MW) and Energia Wind 2020 (330 MW) show the funnel converting from intent to shovel-ready status, with late-2024 auctions moving projects toward 2025-2026 construction starts
NECP-aligned permitting reform momentum
Legislative Decree 190/2024 and the Testo Unico Rinnovabili introduce a single-window system and standardized environmental assessments, trimming the average approval cycle from fourteen to under five years. The Energy Release 2.0 measure accelerates grid-connection procedures, while a presumption of overriding public interest limits legal challenges. Adoption of maritime spatial plans in October 2024 finally brings certainty to offshore zone delimitation.
Lengthy local-permitting & NIMBY pushback
Despite national streamlining efforts, several regions slow or halt projects due to concerns over landscape and tourism. Sardinia's temporary moratorium leaves 2.5 GW of authorized but unbuilt capacity, extending carrying costs for developers and widening the gap between tender awards and actual commissioning.
Other drivers and restraints analyzed in the detailed report include:
- Corporate-PPA pull from hard-to-abate industries
- Floating-offshore wind resource unlock
- Solar-PV cost-competitiveness pressure
For complete list of drivers and restraints, kindly check the Table Of Contents.
Segment Analysis
Onshore assets dominated the Italian wind energy market, accounting for 13.3 GW in 2025, which is equivalent to 99.78% of the installed capacity. Yet offshore additions are forecast to lift the location's share to about 4.9% by 2031 on a 71.6% CAGR, making it the sector's prime growth engine. The Italy wind energy market is tracking a clear pivot as floating foundations overcome the peninsula's steep continental shelf, bringing multi-megawatt turbines to waters 60-200 meters deep.
Early offshore projects, such as Med Wind, Krimisa, and Messapia, leverage 15- to 18-MW machines that reduce foundation counts, lower balance-of-plant costs, and shorten construction timelines. Regulatory certainty from maritime spatial plans and FER2 auction pricing aligns with EU recovery funds to unlock debt financing. Onshore growth continues through repowering in Puglia and Calabria; yet, incremental sites are scarcer, underscoring the rising importance of offshore wind for the Italian wind energy market.
Complete Report Scope:
- By Location
- Onshore
- Offshore
- By Turbine Capacity
- Up to 3 MW
- 3 to 6 MW
- Above 6 MW
- By Application
- Utility-scale
- Commercial and Industrial
- Community Projects
- By Component (Qualitative Analysis)
- Nacelle/Turbine
- Blade
- Tower
- Generator and Gearbox
- Balance-of-System
List of Companies Covered in this Report:
- Enel Green Power
- ERG SpA
- Edison SpA
- EDP Renovaveis
- Alerion Clean Power SpA
- PLT Energia Srl
- Renvico Holding
- Italian Vento Power Corp. Srl
- GreenIT (Plenitude/CDP Equity)
- Falck Renewables-BlueFloat
- Renexia SpA
- Terna Rete Elettrica Nazionale
- General Electric Co.
- Siemens Gamesa Renewable Energy SA
- Vestas Wind Systems AS
- Nordex SE
- MingYang Smart Energy
- Hitachi Energy Ltd.
- Prysmian Group
- Senvion GmbH
Additional Benefits:
- The market estimate (ME) sheet in Excel format
- 3 months of analyst support
TABLE OF CONTENTS
1 Introduction
- 1.1 Study Assumptions & Market Definition
- 1.2 Scope of the Study
2 Research Methodology
3 Executive Summary
4 Market Landscape
- 4.1 Market Overview
- 4.2 Market Drivers
- 4.2.1 Renewable-energy auction pipeline expansion
- 4.2.2 NECP-aligned permitting reform momentum
- 4.2.3 Corporate-PPA pull from hard-to-abate industries
- 4.2.4 Floating-offshore wind resource unlock
- 4.2.5 Grid-digitalisation & storage synergy
- 4.3 Market Restraints
- 4.3.1 Lengthy local-permitting & NIMBY pushback
- 4.3.2 Solar-PV cost-competitiveness pressure
- 4.3.3 Euro-wind-turbine supply-chain inflation
- 4.4 Supply-Chain Analysis
- 4.5 Regulatory Landscape
- 4.6 Technological Outlook
- 4.7 Porter's Five Forces
- 4.7.1 Threat of New Entrants
- 4.7.2 Bargaining Power of Suppliers
- 4.7.3 Bargaining Power of Buyers
- 4.7.4 Threat of Substitutes
- 4.7.5 Competitive Rivalry
- 4.8 PESTLE Analysis
5 Market Size & Growth Forecasts
- 5.1 By Location
- 5.1.1 Onshore
- 5.1.2 Offshore
- 5.2 By Turbine Capacity
- 5.2.1 Up to 3 MW
- 5.2.2 3 to 6 MW
- 5.2.3 Above 6 MW
- 5.3 By Application
- 5.3.1 Utility-scale
- 5.3.2 Commercial and Industrial
- 5.3.3 Community Projects
- 5.4 By Component (Qualitative Analysis)
- 5.4.1 Nacelle/Turbine
- 5.4.2 Blade
- 5.4.3 Tower
- 5.4.4 Generator and Gearbox
- 5.4.5 Balance-of-System
6 Competitive Landscape
- 6.1 Market Concentration
- 6.2 Strategic Moves (M&A, Partnerships, PPAs)
- 6.3 Market Share Analysis (Market Rank/Share for key companies)
- 6.4 Company Profiles (includes Global level Overview, Market level overview, Core Segments, Financials as available, Strategic Information, Products & Services, and Recent Developments)
- 6.4.1 Enel Green Power
- 6.4.2 ERG SpA
- 6.4.3 Edison SpA
- 6.4.4 EDP Renovaveis
- 6.4.5 Alerion Clean Power SpA
- 6.4.6 PLT Energia Srl
- 6.4.7 Renvico Holding
- 6.4.8 Italian Vento Power Corp. Srl
- 6.4.9 GreenIT (Plenitude/CDP Equity)
- 6.4.10 Falck Renewables-BlueFloat
- 6.4.11 Renexia SpA
- 6.4.12 Terna Rete Elettrica Nazionale
- 6.4.13 General Electric Co.
- 6.4.14 Siemens Gamesa Renewable Energy SA
- 6.4.15 Vestas Wind Systems AS
- 6.4.16 Nordex SE
- 6.4.17 MingYang Smart Energy
- 6.4.18 Hitachi Energy Ltd.
- 6.4.19 Prysmian Group
- 6.4.20 Senvion GmbH
7 Market Opportunities & Future Outlook
- 7.1 White-space & Unmet-Need Assessment

