PUBLISHER: Mordor Intelligence | PRODUCT CODE: 2100587

PUBLISHER: Mordor Intelligence | PRODUCT CODE: 2100587
Lead-Acid Battery - Market Share Analysis, Industry Trends & Statistics, Growth Forecasts (2026 - 2031)
According to Mordor Intelligence, the lead-Acid battery market size is projected to expand from USD 49.54 billion in 2025 and USD 51.80 billion in 2026 to USD 64.15 billion by 2031, registering a CAGR of 4.37% between 2026 to 2031.
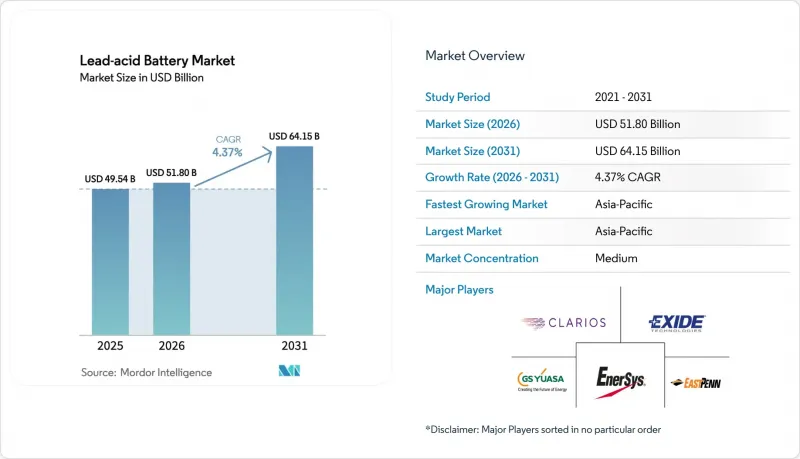
This report is Segmented by Construction Method (Flooded and VRLA), Application (Starting-Lighting-Ignition, Stationary, Motive/Traction, and Portable and Others), and Geography (North America, Europe, Asia-Pacific, South America, and Middle East and Africa). The Market Sizes and Forecasts are Provided in Terms of Value (USD).
Global Lead-Acid Battery Market Trends and Insights
ICE-Vehicle Parc Replacement Demand Remains Resilient
Internal-combustion and hybrid vehicles are predicted to dominate the global fleet well into the next decade, securing a steady replacement cycle for lead-acid batteries. More than 50 million vehicles equipped with absorbent-glass-mat (AGM) batteries required aftermarket replacements in 2025, and this figure will rise as start-stop penetration deepens. China's 280 million-unit vehicle parc and India's 280 million registered vehicles represent substantial reservoirs where battery life averages four years in tropical climates and five years in temperate zones. Consolidation toward DIN-standard sizing in Europe simplifies distributor inventory yet raises replacement costs, creating margin upside for incumbents that control supply chains. These fundamentals keep the lead acid battery market anchored in the automotive aftermarket despite the rise of electric vehicles.
Telecom Network Densification in Emerging Asia & Africa
Unreliable grids drive telecom operators to rely on lead-acid batteries for base-station uptime. India's 400,000 towers face daily outages exceeding eight hours and therefore deploy battery banks rated 300-900 ampere-hours to bridge diesel-generator switchover periods. Sub-Saharan Africa, where 88% of sites are off-grid or bad-grid, opts for sealed VRLA units because theft concerns and thermal-runaway risks restrict lithium-ion adoption. ASEAN nations are adding up to 15,000 towers annually, specifying lead-acid for rural deployments that require low capital investment and straightforward recycling. This persistent demand supports steady shipment growth even as lithium-ion captures urban installations.
Lithium-Ion Cost Curve Crossing Below USD 70 kWh for Automotive
Lithium-ion battery pack prices declined to USD 115 kWh in 2024 and are projected to fall to USD 80 kWh by 2026, closing the total-cost-of-ownership gap in starter and motive-power use cases. Goldman Sachs pegs full drivetrain parity with internal-combustion engines at USD 80 kWh, a threshold that accelerates electric-vehicle adoption and shrinks the captive SLI aftermarket. Chinese suppliers such as CATL and BYD already achieve cell-level costs below USD 75 kWh through vertical integration and scale efficiencies, putting additional pressure on lead-acid producers. McKinsey forecasts lithium-ion will secure 60-70% of the motive-power segment by 2030 as operators prioritize fast charging and higher energy density. The impending cost crossover removes lead-acid's historic advantage, low upfront price, forcing manufacturers to compete on service life, collection infrastructure, and regulatory compliance instead.
Other drivers and restraints analyzed in the detailed report include:
- Data-Center UPS Build-Outs (Tier-2 Cities)
- Aftermarket Revenue Lock-In for Micro-Hybrid SLI Batteries
- Stricter EU End-of-Life Lead Limits
For complete list of drivers and restraints, kindly check the Table Of Contents.
Segment Analysis
VRLA batteries commanded 94.57% of 2025 revenue, and the segment is forecast to compound at 5.51% to 2031. Premium AGM variants deliver 20-30% longer service life and tolerate partial-state-of-charge cycling, making them essential for micro-hybrid vehicles and telecom sites. Graphene-enhanced AGM designs further raise durability, extending cycle life by about 25% in lab tests. The lead acid battery market size for VRLA products is therefore positioned to outpace the overall average.
Flooded batteries held the remaining 5.43% share in 2025. They persist in price-sensitive stationary and motive-power niches where maintenance labor is inexpensive. Carbon and graphene additives now allow 500-700 cycles at 50% depth-of-discharge, matching early VRLA performance at 60-70% of the cost. This technical catch-up keeps flooded chemistry viable, particularly in rural telecom installations across Sub-Saharan Africa and South Asia.
Complete Report Scope:
- By Construction Method
- Flooded
- VRLA
- By Application
- Starting-Lighting-Ignition (SLI)
- Stationary
- Motive/Traction (Forklifts, Golf-carts)
- Portable and Others
- By Geography
- North America
- United States
- Canada
- Mexico
- Europe
- Germany
- United Kingdom
- France
- Spain
- Italy
- NORDIC Countries
- Russia
- Rest of Europe
- Asia Pacific
- China
- India
- Japan
- South Korea
- ASEAN Countries
- Australia and New Zealand
- Rest of Asia Pacific
- South America
- Brazil
- Argentina
- Chile
- Rest of South America
- Middle East and Africa
- Saudi Arabia
- United Arab Emirates
- South Africa
- Egypt
- Rest of Middle East and Africa
- North America
Geography Analysis
Asia-Pacific generated 52.59% of global revenue in 2025 and will grow at 4.83% a year to 2031. China combines a vast vehicle parc, strong start-stop uptake, and policy-driven recycling mandates that favor domestic vertically integrated producers. India's aftermarket offers significant upside, driven by short replacement cycles and a rising share of premium chemistries. ASEAN markets add thousands of new telecom towers each year, most of which specify VRLA batteries due to capital constraints and established recycling routes.
North America exhibits moderate expansion because electric vehicles reduce flooded SLI volume, yet aftermarket resilience persists thanks to 50% start-stop penetration in new-car sales. Recycling compliance costs are climbing as the U.S. Environmental Protection Agency tightens lead exposure limits for urban smelters. Europe faces similar regulatory pressures under the Battery Regulation 2023/1542, which stipulates 70% lead recovery by 2030 and digital battery passports by 2027. Faster EV adoption in Germany, France, and the United Kingdom accelerates SLI volume erosion, but premium AGM replacements boost average selling prices.
South America and the Middle East & Africa remain opportunity regions. Brazil's 50 million-vehicle parc and low EV penetration favor conventional and premium lead-acid formats, although economic volatility occasionally lengthens replacement cycles. Sub-Saharan Africa relies on lead-acid for 88% of base-station sites, citing theft risk and cost barriers to lithium-ion. Gulf Cooperation Council states and South Africa continue to install VRLA UPS systems for data-center expansions linked to digital-economy strategies. Across these regions, established collection and recycling networks reinforce the incumbency of the Lead-Acid Battery Market.
- Clarios
- Exide Technologies
- EnerSys
- GS Yuasa Corp.
- East Penn Manufacturing
- Panasonic
- Amara Raja Batteries
- C&D Technologies
- Leoch International
- Chaowei Power
- Narada Power
- NorthStar Battery
- Crown Battery
- Trojan Battery
- Camel Group
- FIAMM Energy Technology
- Hitachi Chemical
- HOPPECKE
- Shuangdeng (Sacred Sun)
- Sunlight Group
Additional Benefits:
- The market estimate (ME) sheet in Excel format
- 3 months of analyst support
TABLE OF CONTENTS
1 Introduction
- 1.1 Study Assumptions & Market Definition
- 1.2 Scope of the Study
2 Research Methodology
3 Executive Summary
4 Market Landscape
- 4.1 Market Overview
- 4.2 Market Drivers
- 4.2.1 ICE-vehicle parc replacement demand remains resilient
- 4.2.2 Telecom network densification in emerging Asia & Africa
- 4.2.3 Data-center UPS build-outs (Tier-2 cities)
- 4.2.4 After-market revenue lock-in for micro-hybrid SLI batteries
- 4.2.5 "Smart-mixing" additives boosting flooded-cell life
- 4.2.6 Low-speed EV boom in LMICs needing low-cost storage
- 4.3 Market Restraints
- 4.3.1 Li-ion cost curve crossing at <$70 kWh for automotive
- 4.3.2 Stricter EU end-of-life Pb limits
- 4.3.3 Insurance risk premiums for urban recycling clusters
- 4.3.4 Graphene-enhanced AGM cannibalising conventional VRLA
- 4.4 Supply-Chain Analysis
- 4.5 Regulatory Landscape
- 4.6 Technological Outlook
- 4.7 Porter's Five Forces
- 4.7.1 Bargaining Power of Suppliers
- 4.7.2 Bargaining Power of Buyers
- 4.7.3 Threat of New Entrants
- 4.7.4 Threat of Substitutes
- 4.7.5 Intensity of Competitive Rivalry
5 Market Size & Growth Forecasts
- 5.1 By Construction Method
- 5.1.1 Flooded
- 5.1.2 VRLA
- 5.2 By Application
- 5.2.1 Starting-Lighting-Ignition (SLI)
- 5.2.2 Stationary
- 5.2.3 Motive/Traction (Forklifts, Golf-carts)
- 5.2.4 Portable and Others
- 5.3 By Geography
- 5.3.1 North America
- 5.3.1.1 United States
- 5.3.1.2 Canada
- 5.3.1.3 Mexico
- 5.3.2 Europe
- 5.3.2.1 Germany
- 5.3.2.2 United Kingdom
- 5.3.2.3 France
- 5.3.2.4 Spain
- 5.3.2.5 Italy
- 5.3.2.6 NORDIC Countries
- 5.3.2.7 Russia
- 5.3.2.8 Rest of Europe
- 5.3.3 Asia Pacific
- 5.3.3.1 China
- 5.3.3.2 India
- 5.3.3.3 Japan
- 5.3.3.4 South Korea
- 5.3.3.5 ASEAN Countries
- 5.3.3.6 Australia and New Zealand
- 5.3.3.7 Rest of Asia Pacific
- 5.3.4 South America
- 5.3.4.1 Brazil
- 5.3.4.2 Argentina
- 5.3.4.3 Chile
- 5.3.4.4 Rest of South America
- 5.3.5 Middle East and Africa
- 5.3.5.1 Saudi Arabia
- 5.3.5.2 United Arab Emirates
- 5.3.5.3 South Africa
- 5.3.5.4 Egypt
- 5.3.5.5 Rest of Middle East and Africa
- 5.3.1 North America
6 Competitive Landscape
- 6.1 Market Concentration
- 6.2 Strategic Moves (M&A, Partnerships, PPAs)
- 6.3 Market Share Analysis (Market Rank/Share for key companies)
- 6.4 Company Profiles (includes Global level Overview, Market level overview, Core Segments, Financials as available, Strategic Information, Products & Services, and Recent Developments)
- 6.4.1 Clarios
- 6.4.2 Exide Technologies
- 6.4.3 EnerSys
- 6.4.4 GS Yuasa Corp.
- 6.4.5 East Penn Manufacturing
- 6.4.6 Panasonic
- 6.4.7 Amara Raja Batteries
- 6.4.8 C&D Technologies
- 6.4.9 Leoch International
- 6.4.10 Chaowei Power
- 6.4.11 Narada Power
- 6.4.12 NorthStar Battery
- 6.4.13 Crown Battery
- 6.4.14 Trojan Battery
- 6.4.15 Camel Group
- 6.4.16 FIAMM Energy Technology
- 6.4.17 Hitachi Chemical
- 6.4.18 HOPPECKE
- 6.4.19 Shuangdeng (Sacred Sun)
- 6.4.20 Sunlight Group
7 Market Opportunities & Future Outlook
- 7.1 White-space & Unmet-need Assessment

