PUBLISHER: Mordor Intelligence | PRODUCT CODE: 2113219

PUBLISHER: Mordor Intelligence | PRODUCT CODE: 2113219
Thailand Power - Market Share Analysis, Industry Trends & Statistics, Growth Forecasts (2026 - 2031)
According to Mordor Intelligence, the Thailand power market size is expected to grow from 64.61 gigawatt in 2025 to 65.98 gigawatt in 2026 and is forecast to reach 73.29 gigawatt by 2031 at 2.12% CAGR over 2026-2031.
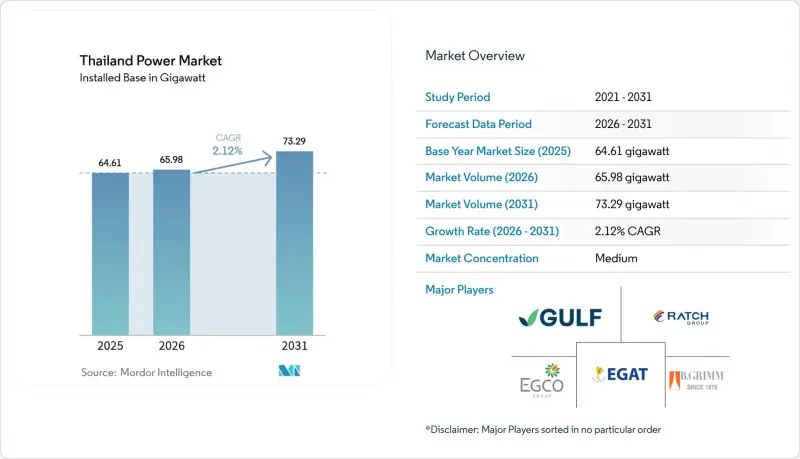
This report is Segmented by Power Source (Thermal, Nuclear, and Renewables) and End-User (Utilities, Commercial and Industrial, and Residential). The Market Sizes and Forecasts are Provided in Terms of Installed Capacity (GW).
Thailand Power Market Trends and Insights
Rising Renewables Capacity Additions
Thailand installed nearly 3 GW of solar photovoltaic (PV) capacity in 2024, increasing cumulative solar capacity to 11.875 GW and making solar the leading contributor to incremental capacity. EGAT's floating-solar roadmap spans nine reservoirs totaling more than 2,700 MW, a strategy that sidesteps land constraints and speeds tie-ins via existing hydro grid nodes. The 2022 feed-in-tariff (FiT) auction awarded 5 GW across solar, wind, and battery projects, but southern congestion has delayed roughly 500 MW of grid connections, exposing generation-transmission interdependencies. Biomass and waste-to-energy remain niche, constrained by seasonal variability in feedstock availability despite supportive tariffs. Finalization of Third-Party Access (TPA) codes in 2025 is expected to unlock up to 2 GW of direct PPAs for data centers and export-manufacturing clusters, reducing reliance on utility offtake.
Modernization of Ageing T&D Grid
EGAT adopted Energy Exemplar's PLEXOS model in January 2025 to optimize dispatch and renewable integration, signaling a digital pivot toward advanced grid analytics. A THB 1.72 billion (USD 50 million) upgrade at the Ban Bueng 2 substation underscores capital intensity as voltage levels rise in the Eastern Economic Corridor. Three pumped-storage projects, totaling 2,472 MW, anchor the flexibility build-out, dwarfing the existing 1,531 MW fleet and providing the inertia lost from coal retirements. The Renewable Energy Forecast Center and Demand Response Control Center will coordinate curtailment once smart meter penetration, still below 10%, improves. Hitachi Energy's grid-forming inverters are being piloted to furnish rapid frequency response compared with synchronous condensers.
High Capex for Large-Scale Grid Upgrades
EGAT's THB 90 billion (USD 2.6 billion) pumped-storage program implies costs exceeding USD 1 million per MW when civil works and environmental mitigation are included. The utility's THB 13 billion (USD 380 million) floating-solar plan further stretches the balance sheet, and multilateral financing exposes projects to exchange-rate volatility. Southern 500 kV line reinforcements, priced at THB 20 billion (USD 580 million), are facing land-acquisition delays, stalling 500 MW of renewable connections and forcing developers into curtailment clauses. EGAT's debt-to-equity ratio is near regulatory ceilings, limiting incremental borrowing unless tariffs rise or equity injections are made. Smaller IPPs cannot self-finance grid extensions, creating stranded generation until Third-Party Access enables private wheeling.
Other drivers and restraints analyzed in the detailed report include:
- Steady Electricity-Demand Growth from EV Rollout
- Rapid Cost Decline of Battery-Integrated Hybrid PV
- Exposure to Volatile Imported LNG Pricing
For complete list of drivers and restraints, kindly check the Table Of Contents.
Segment Analysis
Thermal generation supplied 75.02% of capacity in 2025, yet solar additions lifted renewable output by 5.05% CAGR, signaling a pivot as coal and oil plants retire. Natural gas produced 57.74% of electricity; however, rising LNG dependence and carbon-neutrality targets are pressuring planners to cap new gas builds. Solar reached 11.875 GW on the back of floating-PV tenders totaling 2,656 MW, achieving capacity factors above 18% owing to cooler reservoir temperatures. Hydropower contributed 15.63% via Lao PDR imports, positioning Thailand as a transit hub in the Lao-Thai-Malaysia-Singapore (LTMS-PIP) corridor. Wind remains marginal, although offshore feasibility studies suggest a potential of 2-3 GW post-2028. Biomass and waste-to-energy projects expand slowly due to feedstock constraints. Nuclear and geothermal remain exploratory and are unlikely to influence the Thai power market before 2035.
Energy storage is the fulcrum of the transition: once lithium-ion breaches USD 100 per kWh, solar-plus-battery hybrids will undercut gas peakers, accelerating coal phase-outs and trimming LNG procurement. Consequently, the Thailand power market size for renewable hybrids is projected to grow faster than any thermal category over the 2026-2031 period. Reservoir-based floating solar, bundled with existing hydro tie-ins, offers near-term scale without new rights-of-way, highlighting the role of integrative assets in balancing variable supply.
Complete Report Scope:
- By Power Source
- Thermal (Coal, Natural Gas, Oil and Diesel)
- Nuclear
- Renewables (Solar, Wind, Hydro, Geothermal, Biomass & Waste, Tidal)
- By End User
- Utilities
- Commercial and Industrial
- Residential
- By T&D Voltage Level (Qualitative Analysis only)
- High-Voltage Transmission (Above 230 kV)
- Sub-Transmission (69 to 161 kV)
- Medium-Voltage Distribution (13.2 to 34.5 kV)
- Low-Voltage Distribution (Up to 1 kV)
List of Companies Covered in this Report:
- Electricity Generating Authority of Thailand (EGAT)
- Gulf Energy Development PLC
- RATCH Group Public Co. Ltd.
- Electricity Generating Public Co. Ltd. (EGCO)
- B.Grimm Power PLC
- Glow Energy PLC (GPSC)
- Siemens Gamesa Renewable Energy SA
- Vestas Wind Systems AS
- JinkoSolar Holding Co. Ltd.
- General Electric Company
- Schneider Electric SE
- Mitsubishi Heavy Industries Ltd.
- PTT Public Co. Ltd.
- BCPG PLC
- Wind Energy Holding Co. Ltd.
- Siam Solar Development Co. Ltd.
- Sungrow Power Supply Co. Ltd.
- Huawei Digital Power Thailand
- Hitachi Energy Thailand Ltd.
- SGS SA (Inspection & Certification)
Additional Benefits:
- The market estimate (ME) sheet in Excel format
- 3 months of analyst support
TABLE OF CONTENTS
1 Introduction
- 1.1 Study Assumptions & Market Definition
- 1.2 Scope of the Study
2 Research Methodology
3 Executive Summary
4 Market Landscape
- 4.1 Market Overview
- 4.2 Market Drivers
- 4.2.1 Rising renewables capacity additions
- 4.2.2 Modernization of ageing T&D grid
- 4.2.3 Steady electricity-demand growth from EV rollout
- 4.2.4 Rapid cost decline of battery-integrated hybrid PV
- 4.2.5 Rooftop FiT 2025 spurring distributed solar boom
- 4.2.6 ASEAN LTMS-PIP cross-border power-trade corridor
- 4.3 Market Restraints
- 4.3.1 High capex for large-scale grid upgrades
- 4.3.2 Exposure to volatile imported LNG pricing
- 4.3.3 Southern corridor grid congestion delaying RE projects
- 4.3.4 PDP-2024 postponement creating investor uncertainty
- 4.4 Supply-Chain Analysis
- 4.5 Regulatory Landscape
- 4.6 Technological Outlook
- 4.7 Porter's Five Forces
- 4.7.1 Threat of New Entrants
- 4.7.2 Bargaining Power of Suppliers
- 4.7.3 Bargaining Power of Buyers
- 4.7.4 Threat of Substitutes
- 4.7.5 Competitive Rivalry
- 4.8 PESTLE Analysis
5 Market Size & Growth Forecasts
- 5.1 By Power Source
- 5.1.1 Thermal (Coal, Natural Gas, Oil and Diesel)
- 5.1.2 Nuclear
- 5.1.3 Renewables (Solar, Wind, Hydro, Geothermal, Biomass & Waste, Tidal)
- 5.2 By End User
- 5.2.1 Utilities
- 5.2.2 Commercial and Industrial
- 5.2.3 Residential
- 5.3 By T&D Voltage Level (Qualitative Analysis only)
- 5.3.1 High-Voltage Transmission (Above 230 kV)
- 5.3.2 Sub-Transmission (69 to 161 kV)
- 5.3.3 Medium-Voltage Distribution (13.2 to 34.5 kV)
- 5.3.4 Low-Voltage Distribution (Up to 1 kV)
6 Competitive Landscape
- 6.1 Market Concentration
- 6.2 Strategic Moves (M&A, Partnerships, PPAs)
- 6.3 Market Share Analysis (Market Rank/Share for key companies)
- 6.4 Company Profiles (includes Global level Overview, Market level overview, Core Segments, Financials as available, Strategic Information, Products & Services, and Recent Developments)
- 6.4.1 Electricity Generating Authority of Thailand (EGAT)
- 6.4.2 Gulf Energy Development PLC
- 6.4.3 RATCH Group Public Co. Ltd.
- 6.4.4 Electricity Generating Public Co. Ltd. (EGCO)
- 6.4.5 B.Grimm Power PLC
- 6.4.6 Glow Energy PLC (GPSC)
- 6.4.7 Siemens Gamesa Renewable Energy SA
- 6.4.8 Vestas Wind Systems AS
- 6.4.9 JinkoSolar Holding Co. Ltd.
- 6.4.10 General Electric Company
- 6.4.11 Schneider Electric SE
- 6.4.12 Mitsubishi Heavy Industries Ltd.
- 6.4.13 PTT Public Co. Ltd.
- 6.4.14 BCPG PLC
- 6.4.15 Wind Energy Holding Co. Ltd.
- 6.4.16 Siam Solar Development Co. Ltd.
- 6.4.17 Sungrow Power Supply Co. Ltd.
- 6.4.18 Huawei Digital Power Thailand
- 6.4.19 Hitachi Energy Thailand Ltd.
- 6.4.20 SGS SA (Inspection & Certification)
7 Market Opportunities & Future Outlook
- 7.1 White-space & Unmet-Need Assessment

