PUBLISHER: Mordor Intelligence | PRODUCT CODE: 2114586

PUBLISHER: Mordor Intelligence | PRODUCT CODE: 2114586
Home Office Furniture - Market Share Analysis, Industry Trends & Statistics, Growth Forecasts (2026 - 2031)
According to Mordor Intelligence, the home office furniture market size is expected to grow from USD 38.40 billion in 2025 to USD 41.21 billion in 2026 and is forecast to reach USD 58.63 billion by 2031 at 7.31% CAGR over 2026-2031.
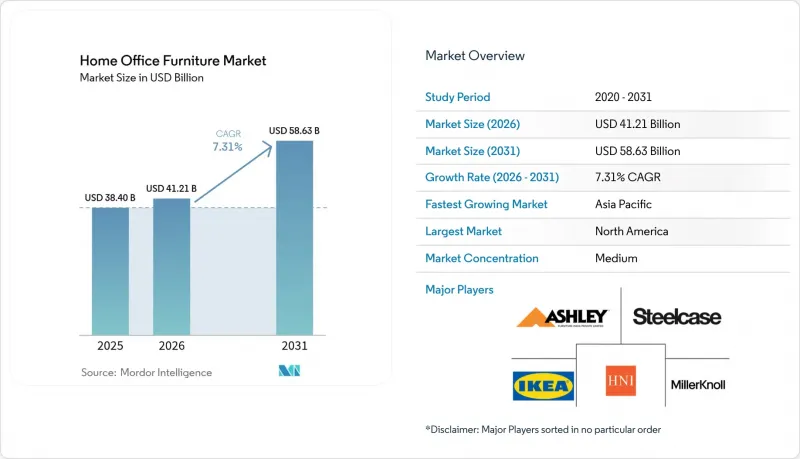
This report is Segmented by Product (Chairs & Sofas, Storage Units, Desks & Tables, Other Home Office Furniture), Distribution Channel (Home Centers/DIY Stores, Specialty Stores, Online, Other Distribution Channels), Material (Wood, Metal, Plastic & Acrylic, Engineered Wood, Other Materials), and Geography (North America, and Other). The Market Forecasts are Provided in Terms of Value (USD).
Global Home Office Furniture Market Trends and Insights
Hybrid & Remote-Work Permanence
Corporate policies now encode two to three remote days weekly, transforming one-time lockdown purchases into predictable replacement cycles that stabilize the home office furniture market. Demand extends beyond knowledge workers as sectors such as financial services and healthcare adopt flexible scheduling to widen talent pools. Employers subsidize desk-chair bundles to cut workers' compensation risk, while insurers increasingly require proof of ergonomic provisioning. Height-adjustable desks, monitor arms, and anti-fatigue mats, therefore, become standard procurement line items rather than elective perks. Sales spikes coincide with corporate hardware refreshes, locking furniture into the same three-to-five-year capex rhythm as laptops. The resulting revenue predictability supports longer production runs that lower unit costs and expand mid-price offerings. Asia-Pacific gains an export advantage because regional factories can switch swiftly between contract and consumer SKUs without violating global quality norms.
Surge in Ergonomic-Wellness Regulations
United States OSHA advisories and EU directives now cover remote settings, mandating adjustable seating, keyboard-tray ergonomics, and minimum lighting levels . Employers that fail to comply face fines and higher health-insurance premiums, prompting bulk-purchase agreements with certified suppliers. Product certification labels-GREENGUARD, BIFMA LEVEL, and GS-act as tender pre-requisites for enterprise buyers. Manufacturers respond by integrating sensors that measure seat occupancy and posture, generating compliance reports that satisfy auditors. Insurance carriers bundle premium discounts with verified ergonomic deployments, reinforcing hardware upgrades every four years. North American demand spikes first, but similar rules appear in Japan and Australia, suggesting global standardization by 2028. The regulatory floor thus underpins a durable premium segment within the home office furniture market.
Volatile Raw-Material Prices
Lumber futures swung 38% between January and July 2025 as wildfire disruptions coincided with tariff uncertainty, eroding gross margins for wood-heavy SKUs. Steel and aluminum spot prices followed energy-cost gyrations, pushing metal-frame chair prices up 6% in North America during Q2. Manufacturers lock in supply through forward contracts, yet smaller vendors lack hedge access and pass costs downstream, dampening demand in price-sensitive segments. Recycled plastic adoption eases some pressures but faces feedstock shortages when consumer-recycling rates dip. Inventory buffers mitigate shocks yet tie up working capital, raising financing costs amid rising interest rates. Price volatility also complicates catalog updates, forcing retailers to issue frequent price-adjustment notices that curb promotional traction. These factors jointly shave nearly two percentage points off the home office furniture market CAGR forecast.
Other drivers and restraints analyzed in the detailed report include:
- Digitally Native Furniture Brands' Scale-Up
- Consumer Shift to Premium Multifunctional Designs
- Rising Freight & Logistics Costs
For complete list of drivers and restraints, kindly check the Table Of Contents.
Segment Analysis
Desks & Tables accounted for 33.74% of 2025 revenue and remain the anchor of the home office furniture market; the segment's stability stems from universal workstation needs and rising ergonomic-height adoption rates. Within this cohort, Smart Desks-a sub-segment equipped with IoT sensors that log posture and usage metrics-are projected to expand at a 10.23% CAGR, far outrunning legacy models. This momentum benefits from enterprise wellness programs that subsidize connected hardware, making real-time analytics a procurement criterion. Chairs & Sofas follow at 29.72% share, lifted by headrest and lumbar innovations that meet updated ISO ergonomics norms. Storage Units, while holding 18.15% share, align closely with hybrid-work patterns as households seek lockable compartments to separate professional files from personal items. The remaining 18.39% share splits across lighting, acoustic panels, and accessories that round out complete workstation environments. Supplier R&D increasingly targets integrated USB-C charging, wireless-power modules, and voice-activated height presets that raise switching costs and deepen replacement cycles.
Manufacturers now market product bundles rather than single SKUs, intensifying cross-selling rates and elevating average order values by 22% according to order-management platform tallies published by leading logistics integrators. Retail analytics show that households purchasing a smart desk have a 42% probability of adding a premium task chair within six months, validating lifecycle-based marketing tactics. Intellectual-property filings for cable-management grommets, sensor arrays, and AI-adjustable actuators jumped 17% year-on-year in 2024, indicating sustained innovation depth. As tech ecosystems mature, interoperability standards emerge that mirror smart-home protocols, enabling third-party accessories to tap into desk-resident data streams. The product hierarchy therefore shifts toward platform-oriented models where desks operate as hubs for peripherals, reinforcing the home office furniture market's premiumization trajectory.
Complete Report Scope:
- By Product
- Chairs & Sofas
- Storage Units
- Desks & Tables
- Other Home Office Furniture
- By Distribution Channel
- Home Centers / DIY Stores
- Specialty Stores
- Online
- Other Distribution Channels
- By Material
- Wood
- Metal
- Plastic & Acrylic
- Engineered Wood (MDF, Particleboard)
- Other Materials
- By Geography
- North America
- Canada
- United States
- Mexico
- South America
- Brazil
- Peru
- Chile
- Argentina
- Rest of South America
- Europe
- United Kingdom
- Germany
- France
- Spain
- Italy
- BENELUX (Belgium, Netherlands, Luxembourg)
- NORDICS (Denmark, Finland, Iceland, Norway, Sweden)
- Rest of Europe
- Asia-Pacific
- India
- China
- Japan
- Australia
- South Korea
- South-East Asia (Singapore, Malaysia, Thailand, Indonesia, Vietnam, Philippines)
- Rest of Asia-Pacific
- Middle East and Africa
- United Arab Emirates
- Saudi Arabia
- South Africa
- Nigeria
- Rest of Middle East and Africa
- North America
Geography Analysis
Asia-Pacific generated 38.05% of global revenue in 2025 and is projected to expand at 9.78% CAGR through 2031 the rare case where the largest market is also the fastest growing. China alone delivers over one-third of worldwide furniture output, leveraging integrated supplier clusters that compress lead times and permit custom finishes without excess inventory . India and Vietnam increasingly absorb overflow orders as wage differentials narrow, diversifying regional capacity and cushioning tariff risks. North America follows with a 32.11% share; robust corporate subsidy programs for remote-work setups offset soft residential remodeling volumes. Europe, at 29.84%, pivots toward eco-design mandates that stimulate demand for certified timber and recyclable polymers, albeit at a more measured 4.86% CAGR.
Middle East & Africa emerges as the second-fastest expanding bloc at 7.32% CAGR, catalyzed by Gulf megaprojects that incorporate smart-city work-live units demanding compact, IoT-ready furnishings. South America advances 6.54%, aided by rising white-collar employment and regional free-trade pacts that lower cross-border duties on flat-pack kits. Regional purchasing preferences differ, yet a convergent trend toward space-efficient, technology-enabled solutions underpins universal growth, making geography a function of adoption speed rather than directional divergence.
- IKEA
- Ashley Furniture Industries
- Steelcase Inc.
- Herman Miller (MillerKnoll)
- HNI Corporation
- Haworth Inc.
- La-Z-Boy Incorporated
- Wayfair Inc.
- AmazonBasics (Amazon)
- Kimball International
- Teknion Corporation
- Knoll (MillerKnoll)
- Sauder Woodworking
- Inter IKEA Systems B.V.
- Vitra International
- Hooker Furniture
- Groupe Seb (Tefal Furniture Line)
- Godrej Interio
- Foshan Home Office (China)
- Dorel Home
Additional Benefits:
- The market estimate (ME) sheet in Excel format
- 3 months of analyst support
TABLE OF CONTENTS
1 Introduction
- 1.1 Study Assumptions & Market Definition
- 1.2 Scope of the Study
2 Research Methodology
3 Executive Summary
4 Market Landscape
- 4.1 Market Overview
- 4.2 Market Drivers
- 4.2.1 Hybrid & remote-work permanence
- 4.2.2 Surge in ergonomic-wellness regulations
- 4.2.3 Digitally native furniture brands' scale-up
- 4.2.4 Consumer shift to premium multifunctional designs
- 4.2.5 Circular-economy resale platforms' growth (under-the-radar)
- 4.2.6 AI-enabled mass-custom manufacturing (under-the-radar)
- 4.3 Market Restraints
- 4.3.1 Volatile raw-material (wood & metal) prices
- 4.3.2 Rising freight & logistics costs
- 4.3.3 Work-from-home tax incentive roll-backs (under-the-radar)
- 4.3.4 Home-space constraints in megacities (under-the-radar)
- 4.4 Value / Supply-Chain Analysis
- 4.5 Regulatory Landscape
- 4.6 Technological Outlook
- 4.7 Porter's Five Forces
- 4.7.1 Threat of New Entrants
- 4.7.2 Bargaining Power of Suppliers
- 4.7.3 Bargaining Power of Buyers
- 4.7.4 Threat of Substitutes
- 4.7.5 Industry Rivalry
5 Market Size & Growth Forecasts
- 5.1 By Product
- 5.1.1 Chairs & Sofas
- 5.1.2 Storage Units
- 5.1.3 Desks & Tables
- 5.1.4 Other Home Office Furniture
- 5.2 By Distribution Channel
- 5.2.1 Home Centers / DIY Stores
- 5.2.2 Specialty Stores
- 5.2.3 Online
- 5.2.4 Other Distribution Channels
- 5.3 By Material
- 5.3.1 Wood
- 5.3.2 Metal
- 5.3.3 Plastic & Acrylic
- 5.3.4 Engineered Wood (MDF, Particleboard)
- 5.3.5 Other Materials
- 5.4 By Geography
- 5.4.1 North America
- 5.4.1.1 Canada
- 5.4.1.2 United States
- 5.4.1.3 Mexico
- 5.4.2 South America
- 5.4.2.1 Brazil
- 5.4.2.2 Peru
- 5.4.2.3 Chile
- 5.4.2.4 Argentina
- 5.4.2.5 Rest of South America
- 5.4.3 Europe
- 5.4.3.1 United Kingdom
- 5.4.3.2 Germany
- 5.4.3.3 France
- 5.4.3.4 Spain
- 5.4.3.5 Italy
- 5.4.3.6 BENELUX (Belgium, Netherlands, Luxembourg)
- 5.4.3.7 NORDICS (Denmark, Finland, Iceland, Norway, Sweden)
- 5.4.3.8 Rest of Europe
- 5.4.4 Asia-Pacific
- 5.4.4.1 India
- 5.4.4.2 China
- 5.4.4.3 Japan
- 5.4.4.4 Australia
- 5.4.4.5 South Korea
- 5.4.4.6 South-East Asia (Singapore, Malaysia, Thailand, Indonesia, Vietnam, Philippines)
- 5.4.4.7 Rest of Asia-Pacific
- 5.4.5 Middle East and Africa
- 5.4.5.1 United Arab Emirates
- 5.4.5.2 Saudi Arabia
- 5.4.5.3 South Africa
- 5.4.5.4 Nigeria
- 5.4.5.5 Rest of Middle East and Africa
- 5.4.1 North America
6 Competitive Landscape
- 6.1 Market Concentration
- 6.2 Strategic Moves
- 6.3 Market Share Analysis
- 6.4 Company Profiles (includes Global level Overview, Market level overview, Core Segments, Financials as available, Strategic Information, Market Rank/Share for key companies, Products & Services, and Recent Developments)
- 6.4.1 IKEA
- 6.4.2 Ashley Furniture Industries
- 6.4.3 Steelcase Inc.
- 6.4.4 Herman Miller (MillerKnoll)
- 6.4.5 HNI Corporation
- 6.4.6 Haworth Inc.
- 6.4.7 La-Z-Boy Incorporated
- 6.4.8 Wayfair Inc.
- 6.4.9 AmazonBasics (Amazon)
- 6.4.10 Kimball International
- 6.4.11 Teknion Corporation
- 6.4.12 Knoll (MillerKnoll)
- 6.4.13 Sauder Woodworking
- 6.4.14 Inter IKEA Systems B.V.
- 6.4.15 Vitra International
- 6.4.16 Hooker Furniture
- 6.4.17 Groupe Seb (Tefal Furniture Line)
- 6.4.18 Godrej Interio
- 6.4.19 Foshan Home Office (China)
- 6.4.20 Dorel Home
7 Market Opportunities & Future Outlook
- 7.1 Modular "Fold-Away" smart desks for micro-apartments
- 7.2 Subscription-based furniture-as-a-service for hybrid workers

