PUBLISHER: Mordor Intelligence | PRODUCT CODE: 2114662

PUBLISHER: Mordor Intelligence | PRODUCT CODE: 2114662
Compressed Natural Gas (CNG) Dispenser - Market Share Analysis, Industry Trends & Statistics, Growth Forecasts (2026 - 2031)
According to Mordor Intelligence, the compressed natural gas dispenser market size is expected to grow from USD 290.75 million in 2025 to USD 317.43 million in 2026 and is forecast to reach USD 492.61 million by 2031 at 9.18% CAGR over 2026-2031.
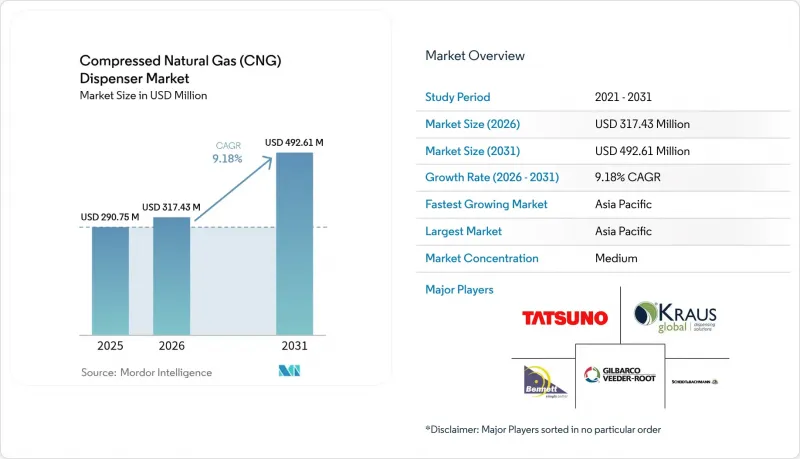
This report is Segmented by Dispenser Configuration (Single-Hose, Dual-Hose, and Multi-Hose), Station Type (Fast-Fill, Time-Fill, and Mobile/Portable), End-User (Public Retail Stations, Private Fleet Depots, Transit and Bus Fleets, and Industrial and Mining Sites), and Geography (North America, Europe, Asia-Pacific, South America, and Middle East and Africa).
Global Compressed Natural Gas (CNG) Dispenser Market Trends and Insights
Government incentives & rapid CNG station build-outs
Federal backing reshapes economic fundamentals for the CNG dispenser market. The United States awarded USD 635 million in 2025 grants covering 27 states, directly subsidizing dispenser installations for freight corridors. The Infrastructure Investment and Jobs Act earmarks USD 2.5 billion over five years for alternative-fuel corridors, providing multi-layered funding that reduces capital risk. California adds USD 95.2 million through its Clean Transportation Program, while a 30% federal tax credit lowers out-of-pocket hardware costs. Similar provincial incentives in Canada and conversion credits in Utah and Georgia expand the support network. Reduced effective project costs shorten payback periods and encourage operators to specify higher-throughput, hydrogen-compatible dispensers that future-proof installations.
Lower total-cost-of-ownership for fleet operators
Natural gas maintains a durable price discount to diesel, averaging USD 1.17 per diesel gallon equivalent in 2025. Heavy-duty engines, such as Cummins' X15N, provide 1,850 lb-ft of torque while eliminating the need for diesel exhaust fluid, thereby cutting running expenses and maintenance downtime. Light-duty bi-fuel pickups achieve combined ranges of nearly 650 miles and realize emission reductions of 13-40% compared to gasoline alternatives. Fleet operators leveraging private time-fill depots lock in multiyear gas contracts, insulating budgets from oil-price volatility. Collectively, these economics bolster procurement plans and funnel recurring demand into the CNG dispenser market.
High up-front CAPEX for fast-fill stations
Turn-key installation for a four-lane fast-fill site can exceed USD 1.8 million, roughly double the outlay of a comparable diesel facility. Financing hurdles rise in rural corridors where throughput forecasts remain uncertain, leading to bank reluctance or higher interest rates. Smaller operators often pivot to time-fill or mobile trailers, postponing large-scale station construction. Although a 30% U.S. federal credit softens cash demands, many projects stall until anchor-tenant agreements guarantee baseline volume.
Other drivers and restraints analyzed in the detailed report include:
- Rising NGV sales in Asia & South America
- IoT-enabled predictive maintenance
- EV-charging roll-out diverting infrastructure budgets
For complete list of drivers and restraints, kindly check the Table Of Contents.
Segment Analysis
The single-hose format retained a 44.15% revenue share in 2025 due to its low entry cost, while multi-hose models are slated for a 12.7% CAGR as operators pursue faster queue turnover during peak hours. Dual-hose units serve midsize fleets that value redundancy without the footprint of four-lane skids. The Wayne Helix 6000 II features cloud telemetry, enabling remote flow validation and predictive part replacement, which reduces life-cycle costs. Shorter fill times translate into higher daily transactions per nozzle, improving return on investment and intensifying capital expenditure for advanced heads in the CNG dispenser market, particularly for configuration upgrades.
Across retrofit programs, station owners replace single hoses with two-hose swing arms that accommodate both 3,000 psig and 3,600 psig vehicles while retaining the original island. Adoption accelerates at metropolitan bus depots that must refuel up to 300 units nightly. Multi-hose up-ratings also dovetail with 15 psi inlet-pressure boosts stemming from grid-compression expansions, which allow tanks to reach nominal cut-out faster and cycle more customers during the same service window.
Complete Report Scope:
- By Dispenser Configuration
- Single-Hose
- Dual-Hose
- Multi-Hose
- By Station Type
- Fast-Fill
- Time-Fill
- Mobile/Portable
- By End-User
- Public Retail Stations
- Private Fleet Depots
- Transit and Bus Fleets
- Industrial and Mining Sites
- By Geography
- North America
- United States
- Canada
- Mexico
- Europe
- Germany
- United Kingdom
- France
- Italy
- NORDIC Countries
- Russia
- Rest of Europe
- Asia-Pacific
- China
- India
- Japan
- South Korea
- ASEAN Countries
- Rest of Asia-Pacific
- South America
- Brazil
- Argentina
- Rest of South America
- Middle East and Africa
- Saudi Arabia
- United Arab Emirates
- South Africa
- Egypt
- Rest of Middle East and Africa
- North America
Geography Analysis
The Asia-Pacific region dominates the global landscape, accounting for a 47.95% revenue share in 2025 and is projected to grow at a 10.4% CAGR through 2031. India's station count is on track to surpass 7,400 by FY 2025, anchoring regional infrastructure depth. China's 38.9 billion m3 CNG consumption in 2023 underscores the massive scale, and municipal air-quality rules are pushing additional bus fleet conversions. Japan and South Korea contribute technology exports-valves, sensors, and payment terminals-creating a vertically integrated supply chain that favors local assembly of advanced dispensers.
North America leverages USD 2.5 billion in corridor funding plus USD 635 million in discretionary awards to extend coverage across 27 states. California's 30% tax credit and 95.2 million clean-transport budget catalyze incremental forecourt builds. The region hosts about 156,000 NGVs-concentrated in trash collection, parcel delivery, and municipal fleets-providing predictable throughput for operators and a stable aftermarket for upgrade kits within the CNG dispenser market.
South America sustains over 5 million NGVs, spearheaded by Argentina's aftermarket conversion market and Bolivia's 52% penetration. Petrobras is installing 1.2 million m3/d biomethane capacity that will feed existing gas grids, ensuring a stable supply for dispensers. Policy-driven pump-price discounts and widening trucking bans on Euro III diesel engines are expected to bolster medium-term demand.
Europe lags in NGV volumes but sets the technical direction through hydrogen-ready forecourt standards. Germany's 1,000th combined H2/CNG sausage-type dispenser came online in 2025, marking the evolution of dual-fuel sites. The continent's focus on renewable gas certificated via RED II drives meter upgrades and traceability modules, compelling service contracts that enrich the European slice of the CNG dispenser market.
- Gilbarco Veeder-Root (ANGI)
- Tatsuno Corporation
- Kraus Global
- Bennett Pump Company
- Scheidt & Bachmann
- Sanki Industry Group
- Censtar Science & Technology
- Parker Hannifin
- Tulsa Gas Technologies
- Greka Engineering
- OPW (Dover)
- Chart Industries
- FTI International Group
- Bosch Rexroth
- WEH GmbH
- Primo Gas Mobility
- IDEX Corporation (Banjo)
- NIHON SEIKI
- Compac Industries
- Gilmore Valve
Additional Benefits:
- The market estimate (ME) sheet in Excel format
- 3 months of analyst support
TABLE OF CONTENTS
1 Introduction
- 1.1 Study Assumptions & Market Definition
- 1.2 Scope of the Study
2 Research Methodology
3 Executive Summary
4 Market Landscape
- 4.1 Market Overview
- 4.2 Market Drivers
- 4.2.1 Government incentives & rapid CNG station build-outs
- 4.2.2 Lower total-cost-of-ownership for fleet operators
- 4.2.3 Rising NGV sales in Asia & South America
- 4.2.4 IoT-enabled predictive maintenance cutting dispenser downtime
- 4.2.5 Hydrogen-ready modular dispensers for multi-energy forecourts
- 4.2.6 Stricter methane-slip monitoring driving meter upgrades
- 4.3 Market Restraints
- 4.3.1 High up-front CAPEX for fast-fill stations
- 4.3.2 EV-charging roll-out diverting infrastructure budgets
- 4.3.3 Gas-quality variability causing calibration/warranty issues
- 4.3.4 Lack of global standards for >300 bar heavy-duty connectors
- 4.4 Supply-Chain Analysis
- 4.5 Regulatory Landscape
- 4.6 Technological Outlook
- 4.7 Porter's Five Forces
- 4.7.1 Bargaining Power of Suppliers
- 4.7.2 Bargaining Power of Consumers
- 4.7.3 Threat of New Entrants
- 4.7.4 Threat of Substitutes
- 4.7.5 Intensity of Competitive Rivalry
5 Market Size & Growth Forecasts
- 5.1 By Dispenser Configuration
- 5.1.1 Single-Hose
- 5.1.2 Dual-Hose
- 5.1.3 Multi-Hose
- 5.2 By Station Type
- 5.2.1 Fast-Fill
- 5.2.2 Time-Fill
- 5.2.3 Mobile/Portable
- 5.3 By End-User
- 5.3.1 Public Retail Stations
- 5.3.2 Private Fleet Depots
- 5.3.3 Transit and Bus Fleets
- 5.3.4 Industrial and Mining Sites
- 5.4 By Geography
- 5.4.1 North America
- 5.4.1.1 United States
- 5.4.1.2 Canada
- 5.4.1.3 Mexico
- 5.4.2 Europe
- 5.4.2.1 Germany
- 5.4.2.2 United Kingdom
- 5.4.2.3 France
- 5.4.2.4 Italy
- 5.4.2.5 NORDIC Countries
- 5.4.2.6 Russia
- 5.4.2.7 Rest of Europe
- 5.4.3 Asia-Pacific
- 5.4.3.1 China
- 5.4.3.2 India
- 5.4.3.3 Japan
- 5.4.3.4 South Korea
- 5.4.3.5 ASEAN Countries
- 5.4.3.6 Rest of Asia-Pacific
- 5.4.4 South America
- 5.4.4.1 Brazil
- 5.4.4.2 Argentina
- 5.4.4.3 Rest of South America
- 5.4.5 Middle East and Africa
- 5.4.5.1 Saudi Arabia
- 5.4.5.2 United Arab Emirates
- 5.4.5.3 South Africa
- 5.4.5.4 Egypt
- 5.4.5.5 Rest of Middle East and Africa
- 5.4.1 North America
6 Competitive Landscape
- 6.1 Market Concentration
- 6.2 Strategic Moves (M&A, Partnerships, PPAs)
- 6.3 Market Share Analysis (Market Rank/Share for key companies)
- 6.4 Company Profiles (includes Global level Overview, Market level overview, Core Segments, Financials as available, Strategic Information, Products & Services, and Recent Developments)
- 6.4.1 Gilbarco Veeder-Root (ANGI)
- 6.4.2 Tatsuno Corporation
- 6.4.3 Kraus Global
- 6.4.4 Bennett Pump Company
- 6.4.5 Scheidt & Bachmann
- 6.4.6 Sanki Industry Group
- 6.4.7 Censtar Science & Technology
- 6.4.8 Parker Hannifin
- 6.4.9 Tulsa Gas Technologies
- 6.4.10 Greka Engineering
- 6.4.11 OPW (Dover)
- 6.4.12 Chart Industries
- 6.4.13 FTI International Group
- 6.4.14 Bosch Rexroth
- 6.4.15 WEH GmbH
- 6.4.16 Primo Gas Mobility
- 6.4.17 IDEX Corporation (Banjo)
- 6.4.18 NIHON SEIKI
- 6.4.19 Compac Industries
- 6.4.20 Gilmore Valve
7 Market Opportunities & Future Outlook
- 7.1 White-Space & Unmet-Need Assessment

