PUBLISHER: Mordor Intelligence | PRODUCT CODE: 2115186

PUBLISHER: Mordor Intelligence | PRODUCT CODE: 2115186
South America Renewable Energy - Market Share Analysis, Industry Trends & Statistics, Growth Forecasts (2026 - 2031)
According to Mordor Intelligence, the South America renewable energy market size in terms of installed base is projected to be 365.97 gigawatt in 2025, 400.78 gigawatt in 2026, and reach 615.31 gigawatt by 2031, growing at a CAGR of 8.95% from 2026 to 2031.
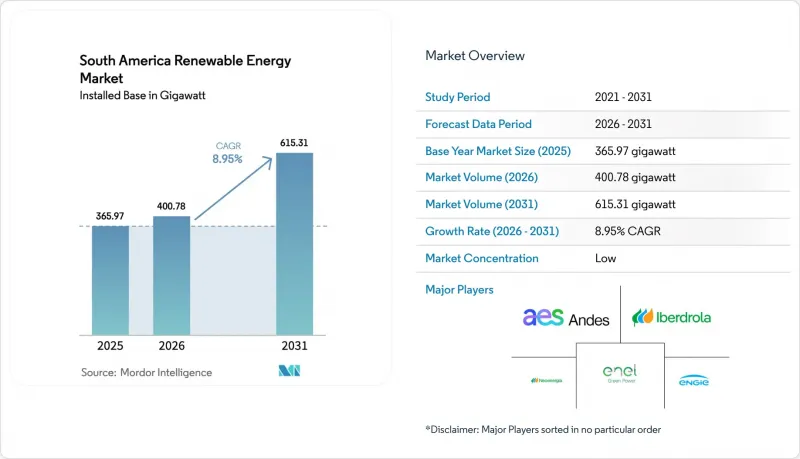
This report is Segmented by Technology (Solar Energy, Wind Energy, Hydropower, Bioenergy, Geothermal, and Ocean Energy), End-User (Utilities, Commercial and Industrial, and Residential), and Geography (Brazil, Chile, Argentina, Colombia, Peru, and Rest of South America). The Market Sizes and Forecasts are Provided in Terms of Installed Capacity (GW).
South America Renewable Energy Market Trends and Insights
Renewable-Energy Auction Programs Accelerating Project Pipeline
Competitive tenders replaced feed-in tariffs after 2023. Brazil, Chile, and Colombia jointly awarded 8.5 GW in 2024-2025, and penalty clauses now force bidders to secure equipment and grid permits before signing, which cuts speculation and speeds build schedules. Brazil's 2024 reserve auction cleared 3.1 GW at USD 28 per MWh, a record low that showed solar-plus-storage can compete with gas peakers. Chile's 2025 2.5 GW call mandates four-hour batteries, ensuring a firm evening supply. Colombia's 2.2 GW award in 2024 reopened its stalled market, while Argentina's provinces tendered 800 MW of wind to bypass federal budget limits. These rules give investors confidence that contracted assets will connect on time and earn revenue from day one.
Declining LCOE for Solar PV and Onshore Wind
Utility-scale solar averaged USD 29 per MWh in 2024 as bifacial modules and single-axis trackers boosted yields by up to 20%. Onshore wind fell to USD 35 per MWh, helped by 120-meter hub heights that catch steadier flows in Brazil's northeast. Chile's Atacama solar parks signed sub-USD 20 PPAs in 2024, prompting early retirement of 1.2 GW of coal. Wind farms in Bahia logged more than 50% capacity factors in 2024, shrinking payback periods to under seven years. Cost parity against fossil assets has ended the need for subsidies, letting corporate buyers sign direct PPAs at tariffs 10-15% below retail rates.
Transmission Bottlenecks and Interconnection Delays
Brazil's Bahia queue reached 5.4 GW in late 2024, stretching average wait times to 18 months as new substations lag project completion. Chile's Atacama backlog stranded 3 GW and caused 1.8 TWh of curtailment in 2024. Patagonia wind projects face a 24-month delay because high-voltage links to Buenos Aires remain unfunded. Long queues raise development costs 10-15% and erode tariff margins, pushing sponsors to demand grid-access guarantees before closing debt.
Other drivers and restraints analyzed in the detailed report include:
- Green-Hydrogen Export Ambitions Driving Utility-Scale Additions
- Mining-Sector Corporate PPAs for Off-Grid Decarbonization
- Local-Content Rules Increasing OEM Capex
For complete list of drivers and restraints, kindly check the Table Of Contents.
Segment Analysis
Hydropower held 52.98% of 2025 capacity, yet environmental permitting and variable rainfall slow new builds. Solar will grow at an 18.30% CAGR, the fastest of any technology, propelled by sub-USD 30 per MWh economics and modular designs that skirt transmission bottlenecks. Wind adds about 4.5 GW annually, boosted by 50% capacity factors in Brazil's northeast. Bioenergy contributes 12 GW through bagasse-fired cogeneration, anchored by Brazil's RenovaBio targets. Emerging niches include pumped-storage hydropower such as Brazil's 401 MW Sinop project, which delivers eight-hour discharge capability. Offshore wind development is taking shape with a 16 GW Brazilian pipeline aiming for first turbines in 2027.
Solar's rapid buildout is shifting the power mix, yet higher variable output requires storage for evening peaks. Concentrated solar power remains marginal beyond Chile's 110 MW Cerro Dominador plant due to USD 6,000-per-kW costs. Geothermal holds 48 MW at Cerro Pabellon, though Enel is exploring another 200 MW in the Andes. Ocean energy is still confined to pilot projects with capital costs above USD 10,000 per kW. The South America renewable energy market size allocated to solar and wind will therefore expand faster than hydro until 2031, provided that storage and grid upgrades keep pace.
Complete Report Scope:
- By Technology
- Solar Energy (PV and CSP)
- Wind Energy (Onshore and Offshore)
- Hydropower (Small, Large, PSH)
- Bioenergy
- Geothermal
- Ocean Energy (Tidal and Wave)
- By End-User
- Utilities
- Commercial and Industrial
- Residential
- By Geography
- Brazil
- Chile
- Argentina
- Colombia
- Peru
- Rest of South America
List of Companies Covered in this Report:
- Enel Green Power S.p.A.
- Iberdrola S.A.
- AES Andes S.A.
- ENGIE Brasil Energia S.A.
- Neoenergia S.A.
- Vestas Wind Systems A/S
- Siemens Gamesa Renewable Energy S.A.
- GE Renewable Energy
- EDF Renouvelables
- Acciona Energia
- Atlas Renewable Energy
- Canadian Solar Inc.
- Trina Solar Co. Ltd.
- Brookfield Renewable Partners L.P.
- Statkraft AS
- Mainstream Renewable Power Ltd.
- ABO Wind AG
- Invenergy LLC
- Suzlon Group
- Grupo Energia Bogota
Additional Benefits:
- The market estimate (ME) sheet in Excel format
- 3 months of analyst support
TABLE OF CONTENTS
1 Introduction
- 1.1 Study Assumptions & Market Definition
- 1.2 Scope of the Study
2 Research Methodology
3 Executive Summary
4 Market Landscape
- 4.1 Market Overview
- 4.2 Market Drivers
- 4.2.1 Renewable-energy auction programs accelerating project pipeline
- 4.2.2 Declining LCOE for solar PV and on-shore wind
- 4.2.3 Green-hydrogen export ambitions driving utility-scale additions
- 4.2.4 Mining-sector corporate PPAs for off-grid decarbonization
- 4.2.5 Grid-connected battery projects enabling higher VRE penetration
- 4.3 Market Restraints
- 4.3.1 Transmission bottlenecks & interconnection delays
- 4.3.2 FX volatility inflating project-finance costs
- 4.3.3 Local-content rules increasing OEM capex
- 4.4 Regulatory Landscape
- 4.5 Technological Outlook
- 4.6 Supply-Chain Analysis
- 4.7 Porter's Five Forces
- 4.7.1 Bargaining Power of Suppliers
- 4.7.2 Bargaining Power of Consumers
- 4.7.3 Threat of New Entrants
- 4.7.4 Threat of Substitute Products & Services
- 4.7.5 Intensity of Competitive Rivalry
5 Market Size & Growth Forecasts
- 5.1 By Technology
- 5.1.1 Solar Energy (PV and CSP)
- 5.1.2 Wind Energy (Onshore and Offshore)
- 5.1.3 Hydropower (Small, Large, PSH)
- 5.1.4 Bioenergy
- 5.1.5 Geothermal
- 5.1.6 Ocean Energy (Tidal and Wave)
- 5.2 By End-User
- 5.2.1 Utilities
- 5.2.2 Commercial and Industrial
- 5.2.3 Residential
- 5.3 By Geography
- 5.3.1 Brazil
- 5.3.2 Chile
- 5.3.3 Argentina
- 5.3.4 Colombia
- 5.3.5 Peru
- 5.3.6 Rest of South America
6 Competitive Landscape
- 6.1 Market Concentration
- 6.2 Strategic Moves (M&A, JVs, Funding, PPAs)
- 6.3 Market Share Analysis (Market Rank/Share for key companies)
- 6.4 Company Profiles (includes Global-level Overview, Market-level Overview, Core Segments, Financials, Strategic Information, Products & Services, Recent Developments)
- 6.4.1 Enel Green Power S.p.A.
- 6.4.2 Iberdrola S.A.
- 6.4.3 AES Andes S.A.
- 6.4.4 ENGIE Brasil Energia S.A.
- 6.4.5 Neoenergia S.A.
- 6.4.6 Vestas Wind Systems A/S
- 6.4.7 Siemens Gamesa Renewable Energy S.A.
- 6.4.8 GE Renewable Energy
- 6.4.9 EDF Renouvelables
- 6.4.10 Acciona Energia
- 6.4.11 Atlas Renewable Energy
- 6.4.12 Canadian Solar Inc.
- 6.4.13 Trina Solar Co. Ltd.
- 6.4.14 Brookfield Renewable Partners L.P.
- 6.4.15 Statkraft AS
- 6.4.16 Mainstream Renewable Power Ltd.
- 6.4.17 ABO Wind AG
- 6.4.18 Invenergy LLC
- 6.4.19 Suzlon Group
- 6.4.20 Grupo Energia Bogota
7 Market Opportunities & Future Outlook
- 7.1 White-space & Unmet-need Assessment

