PUBLISHER: Mordor Intelligence | PRODUCT CODE: 2115910

PUBLISHER: Mordor Intelligence | PRODUCT CODE: 2115910
Solid-State Transformer - Market Share Analysis, Industry Trends & Statistics, Growth Forecasts (2026 - 2031)
According to Mordor Intelligence, the solid-State transformer market size was valued at USD 181.35 million in 2025 and estimated to grow from USD 205.01 million in 2026 to reach USD 378.56 million by 2031, at a CAGR of 13.05% during the forecast period (2026-2031).
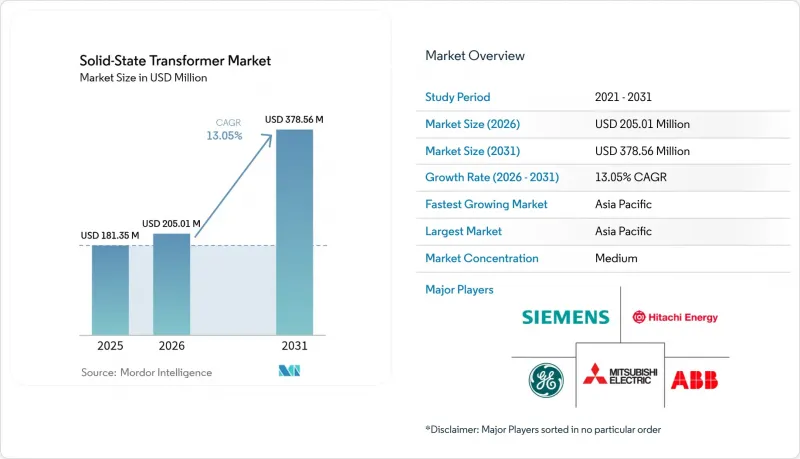
This report is Segmented by Product Type (Power SST, Distribution SST, Traction SST Rail/On-board), Voltage Level (Medium-Voltage, High-Voltage), Application (Smart Grid & Utility Distribution, Renewable & Micro-Grid Integration, EV Fast-Charging Infrastructure, and More), and Geography (North America, South America, Europe, and More). The Market Forecasts are Provided in Terms of Value (USD).
Global Solid-State Transformer Market Trends and Insights
Rapid Smart-Grid Rollout
Distribution companies are accelerating capital plans that incorporate digital protection, advanced metering, and flexible transformers into the same cabinet. The U.S. Department of Energy earmarked USD 3.5 billion in 2024 for distribution upgrades that prioritize solid-state platforms able to furnish bidirectional power flow, harmonic filtering, and islanding within a single enclosure. A parallel EU network-code mandate compels utilities to integrate distributed resources more actively, providing OEMs with predictable order pipelines and encouraging volume pricing. ABB's Smart Substation Control and Protection SSC600 SW demonstrates how virtualized SST controls reduce installation complexity and lower lifecycle expenses by up to 15% in dense urban feeders. As thermal imaging and cybersecurity analytics migrate into firmware, operators gain real-time situational awareness that reinforces regulatory confidence in next-generation grid hardware.
Renewable Integration Requirements
Wind- and solar-heavy feeders face voltage flicker and reactive-power swings that mechanical tap changers cannot contain at millisecond speeds. Solid-state units compensate instantaneously, thereby bolstering grid codes that demand firm power quality in scenarios with 50% renewable penetration. Hitachi Energy's SVC Light STATCOM, installed with SP Energy Networks, freed 280 MW of incremental clean-energy headroom on a legacy UK corridor without stringing new lines. High-frequency operation shrinks core steel, letting developers mount SSTs closer to inverter blocks on constrained sites. As distributed solar portfolios aggregate under virtual power plant contracts, unified control of voltage regulation and fault isolation speeds market clearing, underpinning revenue streams that reward plant owners for ancillary service availability across the solid-state transformer market.
High Capex Versus Legacy Transformers
A solid-state platform can cost two to three times more than an oil-filled equivalent at the same kVA rating, deterring managers who report to tariff-focused regulators. Yet, operating data show 20-year maintenance savings, lower no-load losses, and deferred reactive-compensation capital expenditures that, together, compress payback to seven years in most distribution feeders. Wolfspeed and ON Semiconductor are spending USD 6.5 billion and USD 2 billion, respectively, on 8-inch SiC wafer fabs that, once at scale in 2027, could reduce semiconductor input costs by up to 30%. Utilities bridge interim affordability gaps through leasing models or power-purchase agreements that bundle hardware, software, and uptime guarantees-a financing innovation that is spreading across the solid-state transformer market.
Other drivers and restraints analyzed in the detailed report include:
- Rail Electrification and Traction Demand
- Urban EV Fast-Charging Hub Build-out
- Lack of Standards and Interoperability
For complete list of drivers and restraints, kindly check the Table Of Contents.
Segment Analysis
Traction designs logged just 17.85% revenue in 2025, yet are forecast to outpace every peer at 14.95% CAGR through 2031. The solid-state transformer market size linked to rail and on-board applications is expected to more than double as national electrification programs in Asia-Pacific and Europe accelerate. Weight savings of up to 40% compared to oil-filled predecessors directly translate into higher passenger capacity or freight volume, thereby elevating line profitability without requiring new rolling stock purchases.
Distribution models up to 10 MVA accounted for 40.85% of 2025 sales, as utilities integrated SST pilots into mainstream asset-replacement cycles. Integrated voltage regulation, fault isolation, and power-quality conditioning eliminate the need for discrete capacitor banks and static switches, simplifying inventory management. Power-class SSTs above 10 MVA serve bulk-intertie points but remain a niche owing to bespoke engineering and rigorous high-voltage test protocols. Nevertheless, ABB's SACE Infinitus solid-state breaker demonstrates convergence between protection and conversion, setting the stage for integrated switchgear-plus-transformer racks that could enlarge this slice of the solid-state transformer market.
Complete Report Scope:
- By Product Type
- Power SST (Above 10 MVA)
- Distribution SST (Up to 10 MVA)
- Traction SST (Rail/On-board)
- By Voltage Level
- Medium-Voltage (2 to 36 kV)
- High-Voltage (Above 36 kV)
- By Application
- Smart Grid and Utility Distribution
- Renewable and Micro-grid Integration
- EV Fast-Charging Infrastructure
- Traction and Rail Systems
- Data Centres and ICT Power
- By Geography
- North America
- United States
- Canada
- Mexico
- Europe
- Germany
- United Kingdom
- France
- Italy
- Spain
- Russia
- Rest of Europe
- Asia-Pacific
- China
- India
- Japan
- South Korea
- ASEAN Countries
- Australia and New Zealand
- Rest of Asia-Pacific
- South America
- Brazil
- Argentina
- Chile
- Rest of South America
- Middle East and Africa
- Saudi Arabia
- United Arab Emirates
- South Africa
- Egypt
- Rest of Middle East and Africa
- North America
Geography Analysis
The Asia-Pacific region led with 40.10% revenue in 2025 and is projected to grow at an annual rate of 13.76%, reflecting state-backed spending on semiconductor fabs, rail corridors, and resilient distribution grids. China fuses AI algorithms with dispatch centers, creating demand for self-optimizing transformers that feed predictive-maintenance dashboards. India allocates multiyear capital to electrify its entire broad-gauge rail network, a mandate that alone could absorb thousands of traction modules. Japan emphasizes island-capable microgrids after typhoon outages, while South Korea's smart-city blueprints integrate SST-based EV hubs and rooftop solar arrays. These complementary policy thrusts ensure that the solid-state transformer market in Asia-Pacific sustains top-line leadership and technology learning-curve benefits that spill over to emerging suppliers.
Europe boasts the most mature regulatory environment, with the Green Deal and Fit-for-55 packages catalyzing investment in switchgear that is free of SF6, a potent greenhouse gas. Utilities such as TenneT and SSEN Transmission have already signed multiyear framework agreements for SF6-free, SST-equipped substations. Germany's Energiewende and the UK's net-zero legislation channel funds into voltage-regulation nodes that align with high-voltage direct current (HVDC) corridors, thereby boosting the regional solid-state transformer market, even in areas with modest GDP growth. Collaborative R&D among universities, OEMs, and national labs maintains Europe's edge in control algorithms and advanced packaging techniques.
North America commands a diversified demand profile. The U.S. Department of Defense mandates MIL-STD-3071 microgrid architectures at every domestic base by 2035, anchoring a defense-specific pipeline for hardened SST skids. Hyperscale cloud operators are establishing AI campuses in Virginia, Iowa, and Texas that rely on medium-voltage busways supplied by SST switchboards to reduce copper usage and maintain 99.9% uptime. Canada leverages its hydro resources to dispatch clean power over long distances, utilizing SST nodes for dynamic voltage support, while Mexico's USMCA-aligned industrial parks adopt SST-based feeders that facilitate interconnection with rooftop solar and behind-the-meter storage. Collectively, the region delivers steady, high-margin segments that reinforce global competitiveness within the solid-state transformer market.
- ABB Ltd.
- Siemens AG
- Hitachi Energy
- Mitsubishi Electric Corp.
- GE Vernova
- Eaton Corp.
- Schneider Electric SE
- Alstom SA
- Kirchner Solar Group
- Beta Transformer Technologies
- Varentec Inc.
- Hillcrest Energy Technologies
- Amantys Power Electronics
- Astrol Electronic AG
- Delta Electronics Inc.
- Fuji Electric Co. Ltd.
- Toshiba Energy Systems
- GridBridge LLC
- Jiangsu Zhongtian Technology
- JSHP Transformers
Additional Benefits:
- The market estimate (ME) sheet in Excel format
- 3 months of analyst support
TABLE OF CONTENTS
1 Introduction
- 1.1 Study Assumptions & Market Definition
- 1.2 Scope of the Study
2 Research Methodology
3 Executive Summary
4 Market Landscape
- 4.1 Market Overview
- 4.2 Market Drivers
- 4.2.1 Rapid smart-grid rollout
- 4.2.2 Renewable integration requirements
- 4.2.3 Rail electrification & traction demand
- 4.2.4 AI-data-centre power-density push
- 4.2.5 Urban EV fast-charging hub build-out
- 4.2.6 Defense micro-grid modernization
- 4.3 Market Restraints
- 4.3.1 High capex versus legacy transformers
- 4.3.2 Lack of standards & interoperability
- 4.3.3 SiC/GaN wafer supply bottlenecks
- 4.3.4 Thermal-management issues in arid zones
- 4.4 Supply-Chain Analysis
- 4.5 Regulatory Landscape
- 4.6 Technological Outlook
- 4.7 Porter's Five Forces
- 4.7.1 Threat of New Entrants
- 4.7.2 Bargaining Power of Buyers
- 4.7.3 Bargaining Power of Suppliers
- 4.7.4 Threat of Substitutes
- 4.7.5 Competitive Rivalry
5 Market Size & Growth Forecasts
- 5.1 By Product Type
- 5.1.1 Power SST (Above 10 MVA)
- 5.1.2 Distribution SST (Up to 10 MVA)
- 5.1.3 Traction SST (Rail/On-board)
- 5.2 By Voltage Level
- 5.2.1 Medium-Voltage (2 to 36 kV)
- 5.2.2 High-Voltage (Above 36 kV)
- 5.3 By Application
- 5.3.1 Smart Grid and Utility Distribution
- 5.3.2 Renewable and Micro-grid Integration
- 5.3.3 EV Fast-Charging Infrastructure
- 5.3.4 Traction and Rail Systems
- 5.3.5 Data Centres and ICT Power
- 5.4 By Geography
- 5.4.1 North America
- 5.4.1.1 United States
- 5.4.1.2 Canada
- 5.4.1.3 Mexico
- 5.4.2 Europe
- 5.4.2.1 Germany
- 5.4.2.2 United Kingdom
- 5.4.2.3 France
- 5.4.2.4 Italy
- 5.4.2.5 Spain
- 5.4.2.6 Russia
- 5.4.2.7 Rest of Europe
- 5.4.3 Asia-Pacific
- 5.4.3.1 China
- 5.4.3.2 India
- 5.4.3.3 Japan
- 5.4.3.4 South Korea
- 5.4.3.5 ASEAN Countries
- 5.4.3.6 Australia and New Zealand
- 5.4.3.7 Rest of Asia-Pacific
- 5.4.4 South America
- 5.4.4.1 Brazil
- 5.4.4.2 Argentina
- 5.4.4.3 Chile
- 5.4.4.4 Rest of South America
- 5.4.5 Middle East and Africa
- 5.4.5.1 Saudi Arabia
- 5.4.5.2 United Arab Emirates
- 5.4.5.3 South Africa
- 5.4.5.4 Egypt
- 5.4.5.5 Rest of Middle East and Africa
- 5.4.1 North America
6 Competitive Landscape
- 6.1 Market Concentration
- 6.2 Strategic Moves (M&A, Partnerships, PPAs)
- 6.3 Market Share Analysis (Market Rank/Share for key companies)
- 6.4 Company Profiles (includes Global level Overview, Market level overview, Core Segments, Financials as available, Strategic Information, Products & Services, and Recent Developments)
- 6.4.1 ABB Ltd.
- 6.4.2 Siemens AG
- 6.4.3 Hitachi Energy
- 6.4.4 Mitsubishi Electric Corp.
- 6.4.5 GE Vernova
- 6.4.6 Eaton Corp.
- 6.4.7 Schneider Electric SE
- 6.4.8 Alstom SA
- 6.4.9 Kirchner Solar Group
- 6.4.10 Beta Transformer Technologies
- 6.4.11 Varentec Inc.
- 6.4.12 Hillcrest Energy Technologies
- 6.4.13 Amantys Power Electronics
- 6.4.14 Astrol Electronic AG
- 6.4.15 Delta Electronics Inc.
- 6.4.16 Fuji Electric Co. Ltd.
- 6.4.17 Toshiba Energy Systems
- 6.4.18 GridBridge LLC
- 6.4.19 Jiangsu Zhongtian Technology
- 6.4.20 JSHP Transformers
7 Market Opportunities & Future Outlook
- 7.1 White-space & Unmet-need Assessment

