PUBLISHER: Mordor Intelligence | PRODUCT CODE: 2119797

PUBLISHER: Mordor Intelligence | PRODUCT CODE: 2119797
United States Spectator Sports - Market Share Analysis, Industry Trends & Statistics, Growth Forecasts (2026 - 2031)
According to Mordor Intelligence, the United States spectator sports market reached a market size of USD 51.85 billion in 2026 and is projected to reach USD 70.80 billion by 2031 at a 6.43% CAGR.
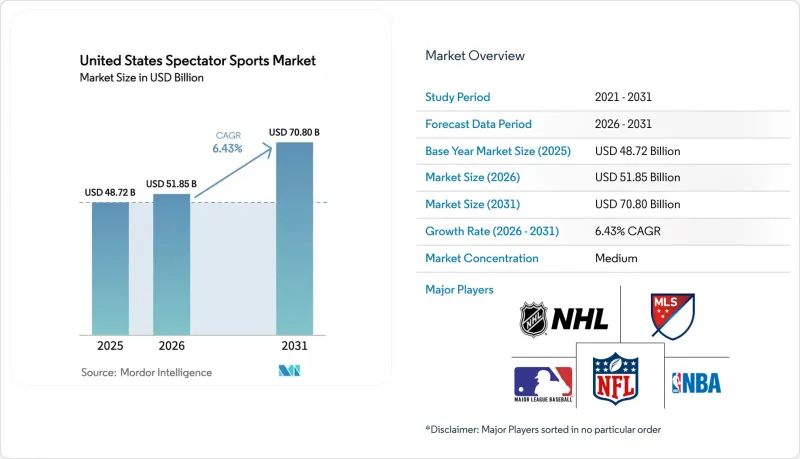
This report is Segmented by Revenue Stream (Ticket Sales, Media Rights, Sponsorship & Advertising, Merchandising & Licensing, Other Ancillary Revenues) and Sport Type (Football/Soccer, Basketball, Baseball, Cricket, Motorsports, Tennis, Golf, Other Sports). Market Forecasts are Provided in Value Terms (USD).
United States Spectator Sports Market Trends and Insights
Increasing Disposable Incomes Boosting Spend on Tickets, Merchandise, and Events
Employment remains solid going into 2026, which supports household incomes and discretionary spending on tickets and live experiences that are core to the United States spectator sports market. Consumer outlays for sports and recreational goods and related services have held at elevated levels within personal consumption accounts, signaling ongoing demand for both in-venue and lifestyle sports products. As inflation moderates relative to 2023 peaks, teams and venues can tier price points and bundle benefits to sustain conversion without eroding premium pricing, a pattern that underpins steady attendance and merchandise flows in 2025 and 2026 for the market. Integrated retail and e-commerce fulfillment at arenas, along with licensed merchandise drops aligned to tentpole events, convert fan energy into higher attach rates on gameday and during key calendar moments. The breadth of live and digital touchpoints from leagues and teams broadens spend categories, including concessions, premium seating, licensed gear, and subscription services, which strengthens baseline growth across the market.
Advancements in Streaming, VR/AR, and Data Analytics Enhancing Fan Engagement
Streaming is pushing record reach for premium games, as platforms realize that exclusive windows drive subscriber acquisition and engagement, which raises content carry value for the United States spectator sports market. Nielsen recorded a historic month for broadcast and streaming in 2025, and the NFL's streaming audience on Thursday night rose strongly, underscoring how digital access sustains national attention on live sports. Immersive venues such as Cosm, backed by an NBA partnership for nationally televised games, add a new shared-reality category that can capture fans who seek premium viewing without the full commitment of season tickets. Teams, rights holders, and sportsbooks are also using real-time data and analytics to personalize offers, enable micro-betting, and tune content feeds, which increases watch time and cross-sell rates in the United States spectator sports market. Together, these technology shifts support higher engagement per fan and open additive revenue lines across rights, subscriptions, sponsorship activation, and commerce.
High Ticket Prices and Escalating Operational Costs
Admission prices rose 13.5% from January 2023 to January 2024, and climbed an additional 6.5% through January 2025, which constrained discretionary budgets for younger fans and price-sensitive households. Venue operators face higher labor, energy, and security costs alongside rising debt service for new facilities, which tightens operating margins even as teams push for premiumization in the United States spectator sports market. Programming rights fees continue to escalate on the distribution side, with Disney's domestic sports networks entering higher-cost windows that lift expenses faster than advertising growth in certain periods. In hockey, salary cap increases compound P&L pressure for smaller-market teams when ticketing growth lags, which forces more reliance on sponsorship uplifts and venue monetization to balance budgets. Although premium seating, clubs, and dynamic pricing help teams protect revenue, maintaining accessibility for families while serving premium demand is an ongoing trade-off in the market.
Other drivers and restraints analyzed in the detailed report include:
- Growth in Media Rights Agreements and Corporate Sponsorship Revenues
- Rising Adoption of Fantasy Sports, Online Betting, and Digital Platforms
- Competition from Alternative Entertainment and Streaming Platforms
For complete list of drivers and restraints, kindly check the Table Of Contents.
Segment Analysis
Sponsorship and advertising held 63.50% of the 2025 United States spectator sports market share as brands concentrated budgets on live inventory that delivers scarce reach and higher attention quality. Financial services, automotive, and alcohol remained anchor categories, while gaming and casinos increased their presence as regulated sports betting scaled nationwide in 2024 and 2025. Media rights continue to be powered by marquee renewals and new streaming windows, including the NBA's 11-year USD 76 billion domestic package and expanding digital-only simulcasts that broaden reach across demographics in the United States spectator sports market. Ticket sales remain vital for game-day atmosphere and community engagement, although price inflation and fewer seats in some new builds create mix-management challenges for teams. Ancillary revenue lines, including concessions and parking, are being modernized with frictionless retail that boosts throughput and per-capita spend, which raises contribution from in-venue operations.
Merchandising and licensing is the fastest-growing stream with a 7.84% CAGR outlook through 2031, as teams and leagues expand direct-to-consumer channels, limited-edition drops, and player-driven programs that extend engagement beyond the arena or stadium, supporting the market. Operators are linking online and in-stadium fulfillment to shorten delivery windows and capture impulse demand during high-attention moments such as playoffs, opening day, and rivalry fixtures. Sponsorship activations are becoming more integrated with commerce and content, with brands using data from streaming, apps, and on-premise interactions to personalize offers and measure conversion, which sustains the largest revenue stream for the United States spectator sports market. Media rights upside remains tied to platform competition and marquee schedules, while ticketing strategies balance premium seating growth with accessible entry points for families and younger fans. The industry is also aligning brand partnerships with digital experiences and youth participation pathways, which strengthens long-term fan pipelines and licensed merchandise demand.
Complete Report Scope:
- By Revenue Stream
- Ticket Sales
- Media Rights
- Sponsorship & Advertising
- Merchandising & Licensing
- Other Ancillary Revenues
- By Sport Type
- Football / Soccer
- Basketball
- Baseball
- Cricket
- Motorsports
- Tennis
- Golf
- Other Sports
List of Companies Covered in this Report:
- National Football League (NFL)
- Major League Baseball (MLB)
- National Basketball Association (NBA)
- National Hockey League (NHL)
- Major League Soccer (MLS)
- Dallas Cowboys
- New York Yankees
- Los Angeles Lakers
- New York Rangers
- Inter Miami CF
- ESPN Inc.
- FOX Sports
- NBC Sports
- Amazon Prime Video
- FanDuel Inc.
- DraftKings
- Caesars Sportsbook
- Vici Properties Inc.
- Fanatics
- Endeavor Group
Additional Benefits:
- The market estimate (ME) sheet in Excel format
- 3 months of analyst support
TABLE OF CONTENTS
1 Introduction
- 1.1 Study Assumptions & Market Definition
- 1.2 Scope of the Study
2 Research Methodology
3 Executive Summary
4 Market Landscape
- 4.1 Market Overview
- 4.2 Market Drivers
- 4.2.1 Increasing disposable incomes boosting spend on tickets, merchandise, and events
- 4.2.2 Advancements in streaming, VR/AR, and data analytics enhancing fan engagement
- 4.2.3 Growth in media rights agreements and corporate sponsorship revenues
- 4.2.4 Rising adoption of fantasy sports, online betting, and digital platforms
- 4.2.5 Expansion of sports tourism, esports, and women's leagues
- 4.2.6 Infrastructure upgrades and recovery in live events supporting attendance growth
- 4.3 Market Restraints
- 4.3.1 High ticket prices and escalating operational costs
- 4.3.2 Competition from alternative entertainment and streaming platforms
- 4.3.3 Economic slowdowns impacting discretionary consumer spending
- 4.3.4 Health, safety, player injury risks, and labor disputes
- 4.4 Macroeconomic & Industry Indicators Impacting the Market
- 4.5 Technology Analysis
- 4.6 Industry Value Chain Analysis
- 4.7 Porter's Five Forces Analysis
- 4.7.1 Threat of New Entrants
- 4.7.2 Bargaining Power of Suppliers
- 4.7.3 Bargaining Power of Buyers
- 4.7.4 Threat of Substitutes
- 4.7.5 Competitive Rivalry
5 Market Size & Growth Forecasts (Value)
- 5.1 By Revenue Stream
- 5.1.1 Ticket Sales
- 5.1.2 Media Rights
- 5.1.3 Sponsorship & Advertising
- 5.1.4 Merchandising & Licensing
- 5.1.5 Other Ancillary Revenues
- 5.2 By Sport Type
- 5.2.1 Football / Soccer
- 5.2.2 Basketball
- 5.2.3 Baseball
- 5.2.4 Cricket
- 5.2.5 Motorsports
- 5.2.6 Tennis
- 5.2.7 Golf
- 5.2.8 Other Sports
6 Competitive Landscape
- 6.1 Market Concentration
- 6.2 Strategic Moves
- 6.3 Market Share Analysis
- 6.4 Company Profiles (includes Global level Overview, Market level overview, Core Segments, Financials as available, Strategic Information, Market Rank/Share for key companies, Products & Services, and Recent Developments)
- 6.4.1 National Football League (NFL)
- 6.4.2 Major League Baseball (MLB)
- 6.4.3 National Basketball Association (NBA)
- 6.4.4 National Hockey League (NHL)
- 6.4.5 Major League Soccer (MLS)
- 6.4.6 Dallas Cowboys
- 6.4.7 New York Yankees
- 6.4.8 Los Angeles Lakers
- 6.4.9 New York Rangers
- 6.4.10 Inter Miami CF
- 6.4.11 ESPN Inc.
- 6.4.12 FOX Sports
- 6.4.13 NBC Sports
- 6.4.14 Amazon Prime Video
- 6.4.15 FanDuel Inc.
- 6.4.16 DraftKings
- 6.4.17 Caesars Sportsbook
- 6.4.18 Vici Properties Inc.
- 6.4.19 Fanatics
- 6.4.20 Endeavor Group
7 Market Opportunities & Future Outlook
- 7.1 Media Rights, Streaming, and Digital Monetization Expansion
- 7.2 Sports Betting, Data, and Fan Experience Integration

