PUBLISHER: Mordor Intelligence | PRODUCT CODE: 2122755

PUBLISHER: Mordor Intelligence | PRODUCT CODE: 2122755
Smart TV - Market Share Analysis, Industry Trends & Statistics, Growth Forecasts (2026 - 2031)
According to Mordor Intelligence, the smart TV market size stands at USD 270.75 billion in 2026 and is projected to reach USD 308.31 billion by 2031, reflecting a 2.63% CAGR over the period.
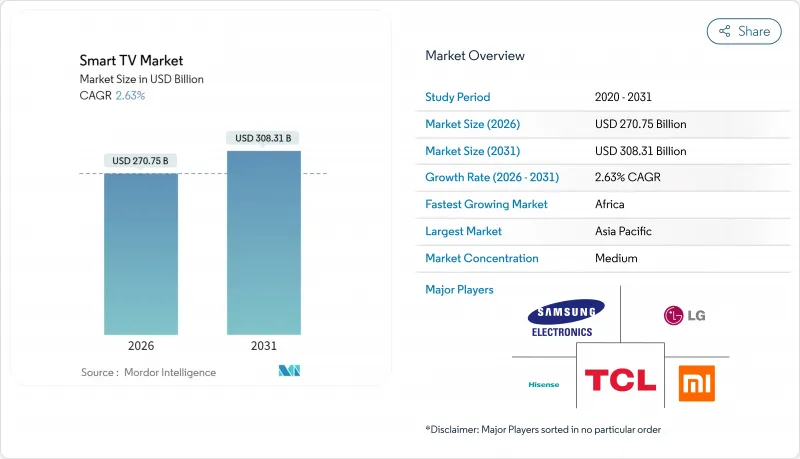
This report is Segmented by Resolution (HD/Full HD, 4K UHD, and 8K UHD), Screen Size (Up To 32 Inch, 33-45 Inch, 46-55 Inch, and More), Panel/Display Technology (LED/LCD, OLED, QLED, Mini-LED, and More), Screen Shape (Flat, and Curved), Operating System (Android TV, and Other/OEM Proprietary), Distribution Channel (Offline Retail, and Online), and Geography. The Market Forecasts are Provided in Terms of Value (USD).
Global Smart TV Market Trends and Insights
Price Erosion of 55-65 inch 4K Sets
Gen 10.5 and Gen 11 Chinese fabs drove 55-inch 4K LCD panel prices below USD 100 in Q2 2025, letting retailers price finished sets under USD 300 in India and Brazil. First-time buyers in tier-2 cities now cross the USD 5,000 household-income threshold and opt for entry-level smart TVs instead of smaller mobile screens. TCL and Hisense, backed by captive CSOT and BOE capacity, protect margins despite falling ASPs, whereas Samsung and LG steer shoppers toward OLED and Mini-LED lines to hold operating margins above 8%. Unit growth clusters in 46- to 55-inch models, yet revenue gains migrate to 65-inch-plus premium tiers supported by cloud gaming and sports streaming. Replacement cycles in mature markets lengthen to eight years as incrementally better picture quality no longer compels an immediate upgrade.
Telecom-Led Fiber Roll-outs
Global fiber-to-the-home subscriptions reached 520 million by end-2025, propelled by 18 million EU connections under the Gigabit Infrastructure Act and 12 million U.S. lines through the Broadband Equity program. Symmetrical gigabit speeds eliminate buffering on 4K streams and allow simultaneous multi-device usage, repositioning the television as each household's entertainment anchor. Operators bundle subsidized smart TVs with 24-month contracts, trading hardware discounts for predictable ARPU growth, a tactic that works best in low pay-TV markets. Cable incumbents answer with Android TV or Roku-based boxes that unify broadcast and IP streams, but the value proposition favors integrated smart sets. As fiber overlaps expand, streaming platforms secure direct device access and shorten onboarding funnels, reinforcing the hardware-content flywheel.
Semiconductor Tightness for Mini-LED Backlights
Mini-LED TVs pack 10,000-20,000 diodes, each requiring a driver IC produced mainly on TSMC's 28 nm nodes that also serve automotive and industrial clients. Lead times hit 18 weeks in H1 2025, forcing TCL and Hisense to pare Mini-LED output to 9% of shipments. Quantum-dot films face similar constraints because annual capacity is capped at 15 million m2 until new lines start after 2027. Brands pre-order panels nine months ahead, locking capital and curbing flexibility when demand shifts. Shortages primarily depress premium inventory in North America and Europe, where Mini-LED competes directly with OLED for high-ARPU buyers.
Other drivers and restraints analyzed in the detailed report include:
- Integration of FAST Channels
- Cloud-Gaming Partnerships Driving 120 Hz TVs
- Low-Cost Streaming Dongles Extending Replacement Cycles
For complete list of drivers and restraints, kindly check the Table Of Contents.
Segment Analysis
4K UHD panels captured 65.66% revenue in 2025, anchoring the smart TV market share in mainstream screen sizes, whereas 8K UHD is forecast to log a 4.56% CAGR through 2031 as early adopters in Japan and South Korea embrace broadcasts of the 2026 FIFA World Cup qualifiers. The smart TV market size for 8K models remains small, yet AI upscaling and promotional tie-ins with next-gen consoles elevate perceived value. EU Tier-2 energy rules add USD 30-40 to bill-of-materials costs, but premium buyers accept higher prices for future-proofing.
Gen 10.5 fabs optimized for 4K cutting now face lower yields when producing 8K panels, so suppliers confine 8K to 75-inch-plus formats where higher ASPs offset utilization losses. Streaming platforms have not prioritized native 8K because subscriber willingness-to-pay does not match the bandwidth premium, leaving upscaling engines as stopgaps. Even so, tech-savvy households see 8K TVs as long-lived centerpieces, sustaining modest but steady demand.
The 46-55 inch bracket led 2025 revenue at 36.78%, yet units above 65 inches are pacing ahead at a 2.92% CAGR, driven by open-plan North American homes with 12-foot viewing distances. Samsung's 98-inch Neo QLED and LG's 97-inch OLED models, priced beyond USD 25,000, promise projector-class immersion without blackout curtains.
Panel makers tilt Gen 10.5 glass toward 75- and 85-inch cuts, elevating yield efficiency from 35% in 2023 to 48% in 2025. Retail prices for 75-inch 4K sets dropped below USD 800 in 2025, accelerating migration from mid-sizes. Sets below 32 inches continue a 2.1% CAGR decline as tablets address casual viewing needs.
Complete Report Scope:
- By Resolution
- HD / Full HD
- 4K UHD
- 8K UHD
- By Screen Size (Inches)
- Up to 32
- 33-45
- 46-55
- 56-65
- Above 65
- By Panel / Display Technology
- LED / LCD
- OLED
- QLED
- Mini-LED
- Micro-LED
- By Screen Shape
- Flat
- Curved
- By Operating System
- Android TV
- Proprietary and Other
- By Distribution Channel
- Offline Retail
- Online
- By Geography
- North America
- United States
- Canada
- Mexico
- Europe
- Germany
- United Kingdom
- France
- Nordics
- Rest of Europe
- South America
- Brazil
- Rest of South America
- Asia Pacific
- China
- Japan
- India
- South-East Asia
- Rest of Asia Pacific
- Middle East
- Gulf Cooperation Council Countries
- Turkey
- Rest of Middle East
- Africa
- South Africa
- Nigeria
- Egypt
- Rest of Africa
- North America
Geography Analysis
Asia Pacific delivered 47.32% of 2025 revenue, underpinned by China's 52 million unit shipments and India's 18 million units. China's household penetration nears saturation at 98%, so growth skews toward 65-inch-plus sets sold to tier-1 urban users. India benefits from localization incentives and rising mid-income households, reducing import reliance to 34%. Southeast Asian exports from Indian plants now fill price gaps below USD 400, spreading the region's influence.
Africa is the fastest-growing region with a 3.12% CAGR through 2031, led by Nigeria's 12 million new fiber connections and Egypt's duty-free panel imports. Mobile-money credit schemes let first-time buyers finance 32- to 43-inch smart TVs over 18 months, enlarging addressable demand. Brands partner with fintech lenders to cap default risk below 2%, unlocking recurring data-recharge bundles that raise overall ARPU.
North America accounted for 22.4% share in 2025, growing at a modest 2.1% CAGR, constrained by streaming-dongle life-extension and an eight-year replacement cycle. However, 65-inch-plus OLED and Mini-LED sales remain brisk among high-income households seeking immersive sports and gaming experiences. Europe's 18.6% share faces similar maturity, and Tier-2 energy-efficiency rules raise compliance costs on 8K sets. South America (6.8% share) capitalizes on Mercosur tariff reductions, while the Middle East (4.9%) sees above-65-inch OLED demand in Gulf Cooperation Council states where disposable income exceeds USD 40,000.
- Samsung Electronics Co., Ltd.
- LG Electronics Inc.
- TCL Technology Group Corp.
- Hisense Group Co., Ltd.
- Xiaomi Corporation
- Sony Group Corporation
- Vizio Holding Corp.
- Panasonic Holdings Corporation
- Sharp Corporation
- TPV Technology Limited (Philips)
- Skyworth Group Ltd.
- Konka Group Co., Ltd.
- Haier Smart Home Co., Ltd.
- Changhong Electric Co., Ltd.
- Toshiba Corporation
- OnePlus Technology (Shenzhen) Co., Ltd.
- VU Technologies Pvt. Ltd.
- Apple Inc.
- Amazon.com Inc. (Fire TV)
- Roku Inc.
Additional Benefits:
- The market estimate (ME) sheet in Excel format
- 3 months of analyst support
TABLE OF CONTENTS
1 INTRODUCTION
- 1.1 Study Assumptions and Market Definition
- 1.2 Scope of the Study
2 RESEARCH METHODOLOGY
3 EXECUTIVE SUMMARY
4 MARKET LANDSCAPE
- 4.1 Market Overview
- 4.2 Market Drivers
- 4.2.1 Price Erosion of 55-65" 4K Sets
- 4.2.2 Telecom-Led Fiber Roll-outs
- 4.2.3 Integration of FAST Channels
- 4.2.4 Cloud-Gaming Partnerships Driving 120 Hz TVs
- 4.2.5 Government Localization Incentives in India
- 4.2.6 Matter-Certified Interoperability
- 4.3 Market Restraints
- 4.3.1 Semiconductor Tightness for Mini-LED Backlights
- 4.3.2 Fragmented Operating-System Ecosystem
- 4.3.3 EU Tier-2 Energy-Efficiency Rules on 8K Sets
- 4.3.4 Low-Cost Streaming Dongles Extending Replacement Cycles
- 4.4 Industry Value-Chain Analysis
- 4.5 Impact of Macroeconomic Factors on the Market
- 4.6 Regulatory Landscape
- 4.7 Technological Outlook
- 4.8 Porter's Five Forces Analysis
- 4.8.1 Bargaining Power of Suppliers
- 4.8.2 Bargaining Power of Buyers
- 4.8.3 Threat of New Entrants
- 4.8.4 Threat of Substitutes
- 4.8.5 Competitive Rivalry
5 MARKET SIZE AND GROWTH FORECASTS (VALUES)
- 5.1 By Resolution
- 5.1.1 HD / Full HD
- 5.1.2 4K UHD
- 5.1.3 8K UHD
- 5.2 By Screen Size (Inches)
- 5.2.1 Up to 32
- 5.2.2 33-45
- 5.2.3 46-55
- 5.2.4 56-65
- 5.2.5 Above 65
- 5.3 By Panel / Display Technology
- 5.3.1 LED / LCD
- 5.3.2 OLED
- 5.3.3 QLED
- 5.3.4 Mini-LED
- 5.3.5 Micro-LED
- 5.4 By Screen Shape
- 5.4.1 Flat
- 5.4.2 Curved
- 5.5 By Operating System
- 5.5.1 Android TV
- 5.5.2 Proprietary and Other
- 5.6 By Distribution Channel
- 5.6.1 Offline Retail
- 5.6.2 Online
- 5.7 By Geography
- 5.7.1 North America
- 5.7.1.1 United States
- 5.7.1.2 Canada
- 5.7.1.3 Mexico
- 5.7.2 Europe
- 5.7.2.1 Germany
- 5.7.2.2 United Kingdom
- 5.7.2.3 France
- 5.7.2.4 Nordics
- 5.7.2.5 Rest of Europe
- 5.7.3 South America
- 5.7.3.1 Brazil
- 5.7.3.2 Rest of South America
- 5.7.4 Asia Pacific
- 5.7.4.1 China
- 5.7.4.2 Japan
- 5.7.4.3 India
- 5.7.4.4 South-East Asia
- 5.7.4.5 Rest of Asia Pacific
- 5.7.5 Middle East
- 5.7.5.1 Gulf Cooperation Council Countries
- 5.7.5.2 Turkey
- 5.7.5.3 Rest of Middle East
- 5.7.6 Africa
- 5.7.6.1 South Africa
- 5.7.6.2 Nigeria
- 5.7.6.3 Egypt
- 5.7.6.4 Rest of Africa
- 5.7.1 North America
6 COMPETITIVE LANDSCAPE
- 6.1 Market Concentration
- 6.2 Strategic Moves
- 6.3 Market Share Analysis
- 6.4 Company Profiles (includes Global Level Overview, Market Level Overview, Core Segments, Financials as Available, Strategic Information, Market Rank / Share for Key Companies, Products and Services, and Recent Developments)
- 6.4.1 Samsung Electronics Co., Ltd.
- 6.4.2 LG Electronics Inc.
- 6.4.3 TCL Technology Group Corp.
- 6.4.4 Hisense Group Co., Ltd.
- 6.4.5 Xiaomi Corporation
- 6.4.6 Sony Group Corporation
- 6.4.7 Vizio Holding Corp.
- 6.4.8 Panasonic Holdings Corporation
- 6.4.9 Sharp Corporation
- 6.4.10 TPV Technology Limited (Philips)
- 6.4.11 Skyworth Group Ltd.
- 6.4.12 Konka Group Co., Ltd.
- 6.4.13 Haier Smart Home Co., Ltd.
- 6.4.14 Changhong Electric Co., Ltd.
- 6.4.15 Toshiba Corporation
- 6.4.16 OnePlus Technology (Shenzhen) Co., Ltd.
- 6.4.17 VU Technologies Pvt. Ltd.
- 6.4.18 Apple Inc.
- 6.4.19 Amazon.com Inc. (Fire TV)
- 6.4.20 Roku Inc.
7 MARKET OPPORTUNITIES AND FUTURE OUTLOOK
- 7.1 White-Space and Unmet-Need Assessment

