PUBLISHER: Mordor Intelligence | PRODUCT CODE: 2122920

PUBLISHER: Mordor Intelligence | PRODUCT CODE: 2122920
PCaaS - Market Share Analysis, Industry Trends & Statistics, Growth Forecasts (2026 - 2031)
According to Mordor Intelligence, the PCaaS market size is expected to grow from USD 81.37 billion in 2025 to USD 100.81 billion in 2026 and is forecasted to reach USD 252.42 billion by 2031 at 20.15% CAGR over 2026-2031.
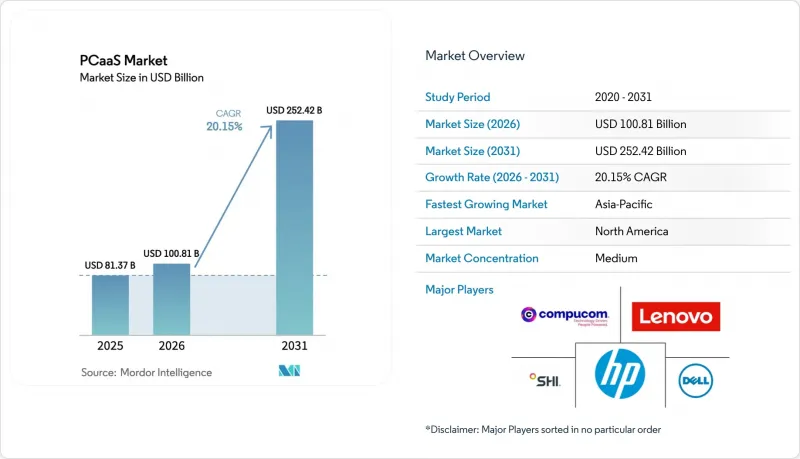
This report is Segmented by Offering (Hardware, Software, Services, Bundled Solutions), Organization Size (Small and Medium Enterprises, Large Enterprises), Service Provider Type (OEM-Led, Managed Service Provider-Led, and More), End-User Industry (BFSI, Healthcare and Life Sciences, IT and Telecom, Government and Defense, and More), and Geography. The Market Forecasts are Provided in Terms of Value (USD).
Global PCaaS Market Trends and Insights
OPEX Preference and Predictable Budgeting for SMEs
Many small and medium enterprises face tighter credit conditions than large corporations. Subscription arrangements eliminate upfront capital hurdles, maintain flat monthly payments, and provide tax advantages under short-term lease accounting. McKinsey reported that adoption rates can hit 30% within a year when switching costs remain under 15% of annual spend. Dell's APEX customers realized a 170% three-year ROI through avoided financing fees and lower provisioning labor. This dynamic drives sustained volume growth for providers that package data migration and device-agnostic consoles into their baseline offerings.
Shorter PC Refresh Cycles from Hybrid Work Adoption
Hybrid work compressed refresh cycles from four years to roughly two as devices endure more physical stress and remote helpdesk constraints. HP's 2025 survey found 89% of IT leaders saw productivity gains when refresh timelines aligned with warranty coverage. Intel telemetry revealed that aging devices generate 2.4 times more support tickets, costing USD 450 yearly per unit. Subscription models shift this obsolescence burden to the provider, ensuring predictable performance.
Lack of Product Differentiation and Vendor Lock-In Fears
Enterprises fear that proprietary consoles and non-transferable licenses will trap them on a single-vendor roadmap. Diverging AI-PC architectures from Intel and AMD compound integration risk. Early-termination clauses add 8-12% to monthly fees, making flexibility costly. System integrators such as SHI International aggregate multi-vendor fleets under a unified SLA, but the underlying lock-in perception still limits uptake.
Other drivers and restraints analyzed in the detailed report include:
- Bundled Security and Lifecycle Management Reducing IT Workload
- ESG-Driven Device Circularity Mandates Boosting PCaaS
- Higher TCO for Long-Life Workstation Workloads
For complete list of drivers and restraints, kindly check the Table Of Contents.
Segment Analysis
Hardware captured 45.92% share of the PCaaS market in 2025. Providers, however, face declining unit margins as component commoditization intensifies. Bundled solutions, including devices, software, and lifecycle services, are forecast to grow at a 21.53% CAGR. Their higher 25-35% gross margins incentivize vendors to emphasize holistic value rather than chipset specifications. Microsoft's Surface Plus plan locks customers into a biannual refresh cycle, generating recurring revenue and reinforcing ecosystem stickiness.
Demand for software-only subscriptions, including virtual desktop and mobile-device-management licenses, is expanding at a 20.1% CAGR, supported by rising compliance overhead. Stand-alone services add another 12.5% to 2025 revenue, particularly depot repair and helpdesk outsourcing, which mitigate labor shortages. Framework's modular laptop remains a niche counter-current, drawing sustainability-minded buyers even as most customers default to turnkey convenience.
Small and medium enterprises controlled 60.44% of the PCaaS market share in 2025. Ongoing credit constraints heighten the appeal of two-year, fixed-fee plans, which simplify budgeting. Typical contracts limit device selection to fewer than five SKUs, thereby reducing operational complexity for both the buyer and the vendor.
Large enterprises, which account for only 39.56% of 2025 revenue, negotiate customized requirements such as white-glove deployment, multi-vendor fleets, and quarterly governance. The TePAS 2 framework in the UK aggregated public-sector demand worth USD 15 billion equivalent, demonstrating the purchasing power of coordinated enterprise procurement.
Complete Report Scope:
- By Offering
- Hardware
- Software
- Services
- Bundled Solutions
- By Organization Size
- Small and Medium Enterprises (SMEs)
- Large Enterprises
- By Service Provider Type
- OEM-led
- Managed Service Provider-led
- Telecom Carrier-led
- System Integrator-led
- By End-User Industry
- BFSI
- Healthcare and Life Sciences
- IT and Telecom
- Government and Defense
- Education
- Retail and E-commerce
- Manufacturing
- Other End-User Industries
- By Geography
- North America
- United States
- Canada
- Mexico
- South America
- Brazil
- Argentina
- Rest of South America
- Europe
- Germany
- United Kingdom
- France
- Italy
- Spain
- Rest of Europe
- Asia-Pacific
- China
- Japan
- India
- South Korea
- ASEAN
- Rest of Asia-Pacific
- Middle East
- Saudi Arabia
- United Arab Emirates
- Rest of Middle East
- Africa
- South Africa
- Nigeria
- Rest of Africa
- North America
Geography Analysis
North America held a 37.21% share of the PC-as-a-Service market in 2025. Enterprises favored operating leases to preserve borrowing capacity as policy rates climbed above 5%. Canada's rising labor costs and Mexico's nearshoring boom are driving demand for bilingual helpdesk support and cross-border asset tracking services from regional MSPs.
Asia Pacific is the fastest-growing region at a projected 22.44% CAGR from 2026 to 2031. India's PC shipments rose 8.1% year over year in Q1 2025, marking seven consecutive quarters of increase. ASEAN's digital economy surpassed USD 300 billion in gross merchandise value, creating fertile ground for subscription-based financing. Japan's cultural preference for long-term vendor relationships, South Korea's 50% 5G penetration, and China's rising urban wages collectively reinforce demand for outsourced device management.
Europe controlled 28.6% revenue in 2025. ESG mandates, such as the EU Ecodesign Regulation, push companies toward centralized take-back programs that are inherently suited to the subscription model. The TePAS 2 framework lowered per-unit subscription costs by up to 18%, enabling smaller public-sector bodies to ride larger economies of scale. South America, the Middle East, and Africa together contribute a small share of 2025 revenue. Saudi Vision 2030 and UAE digital initiatives drive public-sector adoption, while Brazil's expanding digital economy underpins private-sector demand.
- Dell Technologies Inc.
- HP Inc.
- Lenovo Group Limited
- SHI International Corp.
- CompuCom Systems Inc.
- Intel Corporation
- Microsoft Corporation
- Apple Inc.
- Fujitsu Limited
- Samsung Electronics Co., Ltd.
- Acer Inc.
- Dynabook Inc.
- CDW Corporation
- Insight Enterprises Inc.
- Tech Data Corporation (TD SYNNEX)
- Connection (PC Connection, Inc.)
- Brizbang LLC
- Utopia Software LLC
- Lanmark Ltd.
- Telia Company AB
- Symetri AB
- XMA Ltd.
- Computacenter plc
- Deutsche Telekom AG (T-Systems)
Additional Benefits:
- The market estimate (ME) sheet in Excel format
- 3 months of analyst support
TABLE OF CONTENTS
1 INTRODUCTION
- 1.1 Study Assumptions and Market Definition
- 1.2 Scope of the Study
2 RESEARCH METHODOLOGY
3 EXECUTIVE SUMMARY
4 MARKET LANDSCAPE
- 4.1 Market Overview
- 4.2 Market Drivers
- 4.2.1 OPEX Preference and Predictable Budgeting for SMEs
- 4.2.2 Shorter PC Refresh Cycles from Hybrid Work Adoption
- 4.2.3 Bundled Security and Lifecycle Management Reducing IT Workload
- 4.2.4 ESG-driven Device Circularity Mandates Boosting PCaaS
- 4.2.5 Chiplet-based Modular PCs Enabling Upgradeable Leases
- 4.2.6 5G-laptop eSIM Bundles from Telcos Accelerating Subscriptions
- 4.3 Market Restraints
- 4.3.1 Lack of Product Differentiation and Vendor Lock-in Fears
- 4.3.2 Higher TCO for Long-life Workstation Workloads
- 4.3.3 Data-sovereignty and Cross-border Compliance Hurdles
- 4.3.4 Second-hand Device Glut Lowering Residual-value Forecasts
- 4.4 Industry Value Chain Analysis
- 4.5 Regulatory Landscape
- 4.6 Technological Outlook
- 4.7 Porter's Five Forces Analysis
- 4.7.1 Bargaining Power of Suppliers
- 4.7.2 Bargaining Power of Buyers
- 4.7.3 Threat of New Entrants
- 4.7.4 Threat of Substitutes
- 4.7.5 Intensity of Competitive Rivalry
5 MARKET SIZE AND GROWTH FORECASTS (VALUE)
- 5.1 By Offering
- 5.1.1 Hardware
- 5.1.2 Software
- 5.1.3 Services
- 5.1.4 Bundled Solutions
- 5.2 By Organization Size
- 5.2.1 Small and Medium Enterprises (SMEs)
- 5.2.2 Large Enterprises
- 5.3 By Service Provider Type
- 5.3.1 OEM-led
- 5.3.2 Managed Service Provider-led
- 5.3.3 Telecom Carrier-led
- 5.3.4 System Integrator-led
- 5.4 By End-User Industry
- 5.4.1 BFSI
- 5.4.2 Healthcare and Life Sciences
- 5.4.3 IT and Telecom
- 5.4.4 Government and Defense
- 5.4.5 Education
- 5.4.6 Retail and E-commerce
- 5.4.7 Manufacturing
- 5.4.8 Other End-User Industries
- 5.5 By Geography
- 5.5.1 North America
- 5.5.1.1 United States
- 5.5.1.2 Canada
- 5.5.1.3 Mexico
- 5.5.2 South America
- 5.5.2.1 Brazil
- 5.5.2.2 Argentina
- 5.5.2.3 Rest of South America
- 5.5.3 Europe
- 5.5.3.1 Germany
- 5.5.3.2 United Kingdom
- 5.5.3.3 France
- 5.5.3.4 Italy
- 5.5.3.5 Spain
- 5.5.3.6 Rest of Europe
- 5.5.4 Asia-Pacific
- 5.5.4.1 China
- 5.5.4.2 Japan
- 5.5.4.3 India
- 5.5.4.4 South Korea
- 5.5.4.5 ASEAN
- 5.5.4.6 Rest of Asia-Pacific
- 5.5.5 Middle East
- 5.5.5.1 Saudi Arabia
- 5.5.5.2 United Arab Emirates
- 5.5.5.3 Rest of Middle East
- 5.5.6 Africa
- 5.5.6.1 South Africa
- 5.5.6.2 Nigeria
- 5.5.6.3 Rest of Africa
- 5.5.1 North America
6 COMPETITIVE LANDSCAPE
- 6.1 Market Concentration
- 6.2 Strategic Moves
- 6.3 Market Share Analysis
- 6.4 Company Profiles (includes Global level Overview, Market Level Overview, Core Segments, Financials as Available, Strategic Information, Market Rank/Share for Key Companies, Products and Services, and Recent Developments)
- 6.4.1 Dell Technologies Inc.
- 6.4.2 HP Inc.
- 6.4.3 Lenovo Group Limited
- 6.4.4 SHI International Corp.
- 6.4.5 CompuCom Systems Inc.
- 6.4.6 Intel Corporation
- 6.4.7 Microsoft Corporation
- 6.4.8 Apple Inc.
- 6.4.9 Fujitsu Limited
- 6.4.10 Samsung Electronics Co., Ltd.
- 6.4.11 Acer Inc.
- 6.4.12 Dynabook Inc.
- 6.4.13 CDW Corporation
- 6.4.14 Insight Enterprises Inc.
- 6.4.15 Tech Data Corporation (TD SYNNEX)
- 6.4.16 Connection (PC Connection, Inc.)
- 6.4.17 Brizbang LLC
- 6.4.18 Utopia Software LLC
- 6.4.19 Lanmark Ltd.
- 6.4.20 Telia Company AB
- 6.4.21 Symetri AB
- 6.4.22 XMA Ltd.
- 6.4.23 Computacenter plc
- 6.4.24 Deutsche Telekom AG (T-Systems)
7 MARKET OPPORTUNITIES AND FUTURE OUTLOOK
- 7.1 White-space and Unmet-Need Assessment

