PUBLISHER: Mordor Intelligence | PRODUCT CODE: 2123119

PUBLISHER: Mordor Intelligence | PRODUCT CODE: 2123119
Smart Home Installation Service - Market Share Analysis, Industry Trends & Statistics, Growth Forecasts (2026 - 2031)
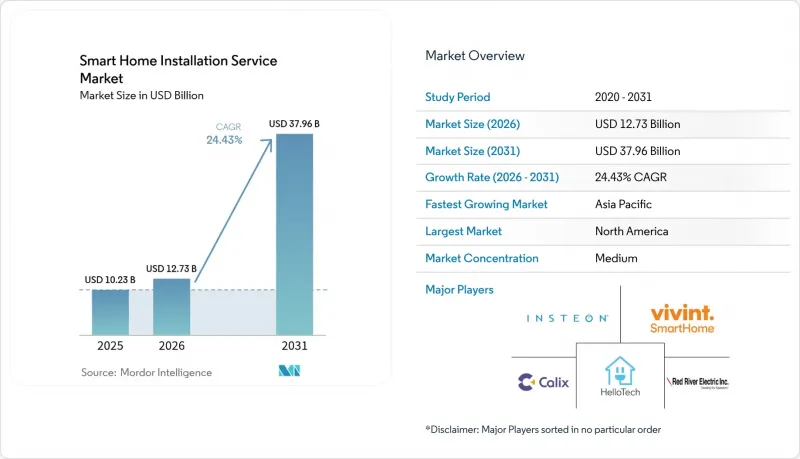
According to Mordor Intelligence, the smart home installation service market size is expected to grow from USD 10.23 billion in 2025 to USD 12.73 billion in 2026 and is forecast to reach USD 37.96 billion by 2031 at 24.43% CAGR over 2026-2031.
This report is Segmented by System (Lighting Control, and More), Channel (Retailers, and More), Installation Type (Professional-Installed, and DIY), Customer Type (Residential, and More), Dwelling Type (Single-Family Homes, and More), Connectivity Standard (Wi-Fi, Zigbee, and More), and Geography (North America, and More). The Market Forecasts are Provided in Terms of Value (USD).
Global Smart Home Installation Service Market Trends and Insights
Rapid Broadband and 5G Rollouts Enabling Professional Installations
Fiber-to-the-premises coverage reached 64% of United States households by mid-2024, while India logged 945 million broadband subscriptions the same year. South Korea completed nationwide 5G standalone deployment in early 2024, removing latency barriers for real-time video analytics. These infrastructure gains shift the customer pain point from connectivity to configuration, prompting households to pay for expert network segmentation and traffic prioritization. Professional installers now bundle mesh-router tuning and device commissioning, commanding premium fees in dense urban markets. Apartment managers also rely on installers to centralize access controls and tenant authentication, turning connectivity upgrades into recurring service contracts.
Government Tax Incentives for Energy-Efficient Retrofits
The U.S. Inflation Reduction Act extends a USD 2,000 annual credit for smart HVAC controls through 2032. Germany set aside EUR 300 million (USD 339 million) in 2024 to fund integrated energy-saving systems. India's Smart Meter National Programme requires real-time consumption feedback, which in turn drives demand for in-home displays and sub-metering installations. These incentives compress payback periods for smart thermostats and lighting controls, making professional installation economically attractive even in retrofit scenarios. Service providers that navigate rebate paperwork and certification standards secure a trusted-advisor role, deepening customer stickiness.
Data Privacy and Security Concerns
The European Data Protection Board classifies installers as data controllers under GDPR, exposing firms to fines of up to EUR 20 million for mishandling sensor data. California's Privacy Rights Act demands granular disclosures on data retention and third-party sharing. A 2024 breach involving 1.2 million cameras highlighted the financial risk of weak encryption, prompting insurers to exclude cyber liability coverage for unencrypted installations. Installers now pursue cybersecurity certifications and offer network segmentation, but these add 15-20% to project cost and slow adoption among price-sensitive customers.
Other drivers and restraints analyzed in the detailed report include:
- Growth of Insurance-Linked Discounts for Connected Homes
- Emerging Demand for Aging-in-Place Assisted-Living Solutions
- Shortage of Certified Smart Home Installers
For complete list of drivers and restraints, kindly check the Table Of Contents.
Segment Analysis
Home monitoring and security systems accounted for 45.86% of the smart home installation service market share in 2025, driving overall revenue for installers. Demand stems from persistent concerns about crime, the falling cost of AI-enabled cameras, and the appeal of bundled monitoring contracts that lock in recurring fees. As a result, professional firms position security as the entry point for broader device ecosystems, often returning to the same household later to layer on additional sensors or lighting controls. In contrast, smart appliances represent the fastest-growing use case at a 26.12% CAGR toward 2031, as brands embed Wi-Fi and Thread radios in refrigerators, ovens, and washers that require professional commissioning. Manufacturers now ship appliances with over-the-air update capability, encouraging homeowners to pay technicians for firmware management, warranty validation, and predictive-maintenance setup.
Thread adoption inside connected kitchen and laundry equipment is cutting installation time by simplifying onboarding processes, which further widens installer margins. Matter-certified appliances eliminate the need for proprietary apps, enabling a single commissioning workflow that reduces truck-rolls and post-visit support calls. As the installed base scales, the smart home installation service market size benefits from follow-up visits to integrate appliances into centralized energy dashboards, pushing upsell potential beyond the original project scope. Legacy Zigbee and Z-Wave devices remain in older security panels, so installers maintain dual expertise to avoid stranding earlier investments while shepherding households toward future-proof, Thread-based networks.
Retail stores accounted for 51.62% of the smart home installation service market share in 2025, buoyed by live demo displays and in-person advisors who convert shoppers into same-day installation customers. Big-box chains combine point-of-sale financing with white-glove technician dispatch, creating convenience that justifies premium pricing. However, e-commerce platforms are expanding at a 24.88% CAGR thanks to transparent pricing, next-day delivery, and checkout flows that bundle installation services in one click. Online ratings and guaranteed arrival windows improve buyer confidence, eroding the showroom advantage traditional retailers once held.
Installers operating through digital aggregators must accept standardized price lists and 15-25% commissions, which compress gross margins but deliver steady project volume. Some independent firms respond by boosting direct-to-consumer marketing, relying on localized search ads and referral incentives to bypass marketplace fees. Original equipment manufacturers such as integrated security providers still favor vertically aligned sales models, capturing the entire margin stack from hardware to monitoring. The competitive tension among storefronts, e-commerce, and OEM-direct models expands the overall smart home installation service market size by providing consumers with multiple, channel-agnostic paths to professional help.
Complete Report Scope:
- By System
- Lighting Control
- Home Monitoring/Security
- Thermostat
- Video Entertainment
- Smart Appliances
- Other Systems
- By Channel
- Retailers
- E-Commerce
- Original Equipment Manufacturer (OEM)
- By Installation Type
- Professional-Installed
- Do-It-Yourself (DIY)
- By Customer Type
- Residential
- Commercial/Small Business
- By Dwelling Type
- Single-Family Homes
- Multi-Unit Dwellings
- New-Build Constructions
- Retrofit Projects
- By Connectivity Standard
- Wi-Fi
- Zigbee
- Z-Wave
- Thread
- Bluetooth Mesh
- By Geography
- North America
- United States
- Canada
- Mexico
- South America
- Brazil
- Argentina
- Rest of South America
- Europe
- Germany
- United Kingdom
- France
- Italy
- Spain
- Rest of Europe
- Asia Pacific
- China
- Japan
- India
- South Korea
- Rest of Asia Pacific
- Middle East and Africa
- Middle East
- Saudi Arabia
- United Arab Emirates
- Turkey
- Rest of Middle East
- Africa
- South Africa
- Nigeria
- Kenya
- Rest of Africa
- Middle East
- North America
Geography Analysis
North America maintained a 39.38% share of the smart home installation service market in 2025. High broadband penetration, homeowner insurance incentives, and strong retail chains underpin demand in the United States and Canada. Mexico presents an emerging opportunity as fiber rollouts in major metropolitan areas unlock multi-device demand, although installer scarcity outside urban centers limits scale. Growth here is moderating as affluent suburbs reach saturation, prompting installers to shift toward retrofit upgrades and commercial projects.
Asia Pacific is the fastest-growing region with a 25.12% CAGR outlook. China's mandate for smart-ready construction in new towers compels developers to pre-install conduits and panels. India's fiber-to-the-home base exceeded 30 million subscribers in 2024, with broadband packages bundling smart-home starter kits and local installation. Japan's aging population fuels government subsidies for assistive sensors, while South Korea's 5G backbone supports real-time analytics and remote diagnostics. Language diversity, price sensitivity, and regulatory fragmentation continue to challenge cross-border service standardization; however, urban density creates volume efficiencies for installers.
Europe, the Middle East, and Africa present mixed prospects. Germany and the United Kingdom benefit from energy efficiency mandates and mature e-commerce, but GDPR compliance adds cost and slows down decision-making cycles. Southern European markets grow more slowly due to lower homeownership and fragmented installer bases. In the Middle East, the United Arab Emirates and Saudi Arabia are investing in smart-building certifications as part of their diversification plans, driving high-end installation contracts. Africa remains nascent, with limited development, primarily confined to gated communities in South Africa, Nigeria, and Kenya, where broadband and stable power are available. Currency volatility and import duties prompt installers to partner with local distributors to hedge risk.
- HelloTech Inc.
- Handy Technologies, Inc.
- Vivint Inc.
- Puls Technologies Inc.
- Calix, Inc.
- Best Buy Co., Inc.
- Cox Communications, Inc.
- Comcast Corporation
- ADT Inc.
- Alarm.com Holdings, Inc.
- Resideo Technologies, Inc.
- Red River Electric, Inc.
- Insteon Holdings LLC
- Smartify Home Automation Limited
- Finite Solutions Limited
- Miami Electric Masters, Inc.
- Techy Company
- Insteon Holdings LLC
- SmartRent, Inc.
- Amazon.com, Inc.
- Calitt Smart Homes Ltd.
- Plugit Home Services GmbH
- Planet Smart Home Pty Ltd
- One-Stop IoT Solutions Co., Ltd.
Additional Benefits:
- The market estimate (ME) sheet in Excel format
- 3 months of analyst support
TABLE OF CONTENTS
1 INTRODUCTION
- 1.1 Study Assumptions and Market Definition
- 1.2 Scope of the Study
2 RESEARCH METHODOLOGY
3 EXECUTIVE SUMMARY
4 MARKET LANDSCAPE
- 4.1 Market Drivers
- 4.1.1 Rising Disposable Income in Developing Countries
- 4.1.2 Rapid Broadband and 5G Rollouts Enabling Professional Installations
- 4.1.3 Declining Average Selling Price of Smart Home Hubs
- 4.1.4 Government Tax Incentives for Energy-Efficient Retrofits
- 4.1.5 Growth of Insurance-Linked Discounts for Connected Homes
- 4.1.6 Emerging Demand for Aging-in-Place Assisted-Living Solutions
- 4.2 Market Restraints
- 4.2.1 Data Privacy and Security Concerns
- 4.2.2 Shortage of Certified Smart Home Installers
- 4.2.3 Inter-operability Issues Among Proprietary Ecosystems
- 4.2.4 Inflation-Driven Slowdown in Residential Construction
- 4.3 Industry Value Chain Analysis
- 4.4 Regulatory Landscape
- 4.5 Technological Outlook
- 4.6 Impact of Macroeconomic Factors on the Market
- 4.7 Porter's Five Forces Analysis
- 4.7.1 Threat of New Entrants
- 4.7.2 Bargaining Power of Buyers
- 4.7.3 Bargaining Power of Suppliers
- 4.7.4 Threat of Substitutes
- 4.7.5 Intensity of Competitive Rivalry
5 MARKET SIZE AND GROWTH FORECASTS (VALUE)
- 5.1 By System
- 5.1.1 Lighting Control
- 5.1.2 Home Monitoring/Security
- 5.1.3 Thermostat
- 5.1.4 Video Entertainment
- 5.1.5 Smart Appliances
- 5.1.6 Other Systems
- 5.2 By Channel
- 5.2.1 Retailers
- 5.2.2 E-Commerce
- 5.2.3 Original Equipment Manufacturer (OEM)
- 5.3 By Installation Type
- 5.3.1 Professional-Installed
- 5.3.2 Do-It-Yourself (DIY)
- 5.4 By Customer Type
- 5.4.1 Residential
- 5.4.2 Commercial/Small Business
- 5.5 By Dwelling Type
- 5.5.1 Single-Family Homes
- 5.5.2 Multi-Unit Dwellings
- 5.5.3 New-Build Constructions
- 5.5.4 Retrofit Projects
- 5.6 By Connectivity Standard
- 5.6.1 Wi-Fi
- 5.6.2 Zigbee
- 5.6.3 Z-Wave
- 5.6.4 Thread
- 5.6.5 Bluetooth Mesh
- 5.7 By Geography
- 5.7.1 North America
- 5.7.1.1 United States
- 5.7.1.2 Canada
- 5.7.1.3 Mexico
- 5.7.2 South America
- 5.7.2.1 Brazil
- 5.7.2.2 Argentina
- 5.7.2.3 Rest of South America
- 5.7.3 Europe
- 5.7.3.1 Germany
- 5.7.3.2 United Kingdom
- 5.7.3.3 France
- 5.7.3.4 Italy
- 5.7.3.5 Spain
- 5.7.3.6 Rest of Europe
- 5.7.4 Asia Pacific
- 5.7.4.1 China
- 5.7.4.2 Japan
- 5.7.4.3 India
- 5.7.4.4 South Korea
- 5.7.4.5 Rest of Asia Pacific
- 5.7.5 Middle East and Africa
- 5.7.5.1 Middle East
- 5.7.5.1.1 Saudi Arabia
- 5.7.5.1.2 United Arab Emirates
- 5.7.5.1.3 Turkey
- 5.7.5.1.4 Rest of Middle East
- 5.7.5.2 Africa
- 5.7.5.2.1 South Africa
- 5.7.5.2.2 Nigeria
- 5.7.5.2.3 Kenya
- 5.7.5.2.4 Rest of Africa
- 5.7.5.1 Middle East
- 5.7.1 North America
6 COMPETITIVE LANDSCAPE
- 6.1 Market Concentration
- 6.2 Strategic Moves
- 6.3 Market Share Analysis
- 6.4 Company Profiles (includes Global level Overview, Market level Overview, Core Segments, Financials as available, Strategic Information, Market Rank/Share for key companies, Products and Services, and Recent Developments)
- 6.4.1 HelloTech Inc.
- 6.4.2 Handy Technologies, Inc.
- 6.4.3 Vivint Inc.
- 6.4.4 Puls Technologies Inc.
- 6.4.5 Calix, Inc.
- 6.4.6 Best Buy Co., Inc.
- 6.4.7 Cox Communications, Inc.
- 6.4.8 Comcast Corporation
- 6.4.9 ADT Inc.
- 6.4.10 Alarm.com Holdings, Inc.
- 6.4.11 Resideo Technologies, Inc.
- 6.4.12 Red River Electric, Inc.
- 6.4.13 Insteon Holdings LLC
- 6.4.14 Smartify Home Automation Limited
- 6.4.15 Finite Solutions Limited
- 6.4.16 Miami Electric Masters, Inc.
- 6.4.17 Techy Company
- 6.4.18 Insteon Holdings LLC
- 6.4.19 SmartRent, Inc.
- 6.4.20 Amazon.com, Inc.
- 6.4.21 Calitt Smart Homes Ltd.
- 6.4.22 Plugit Home Services GmbH
- 6.4.23 Planet Smart Home Pty Ltd
- 6.4.24 One-Stop IoT Solutions Co., Ltd.
7 MARKET OPPORTUNITIES AND FUTURE OUTLOOK
- 7.1 White-Space and Unmet-Need Assessment

