PUBLISHER: Mordor Intelligence | PRODUCT CODE: 2124566

PUBLISHER: Mordor Intelligence | PRODUCT CODE: 2124566
Smart Home Safety - Market Share Analysis, Industry Trends & Statistics, Growth Forecasts (2026 - 2031)
According to Mordor Intelligence, smart home safety market size in 2026 is estimated at USD 41.69 billion, growing from 2025 value of USD 35.67 billion with 2031 projections showing USD 90.93 billion, growing at 16.88% CAGR over 2026-2031.
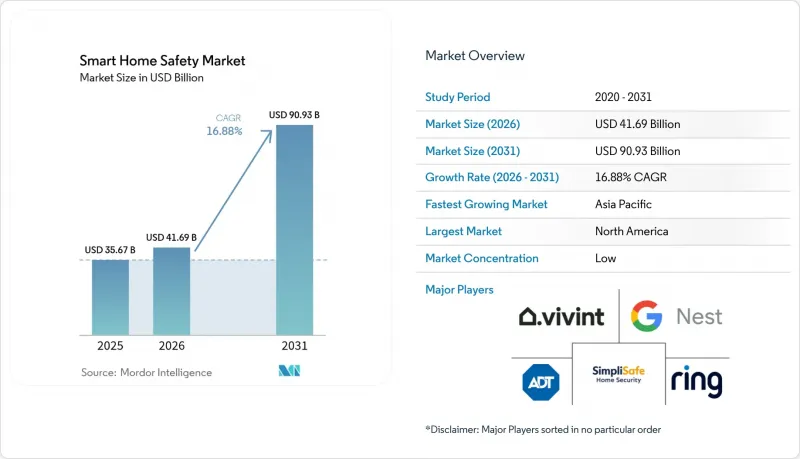
This report is Segmented by Device Type (Smart Alarms, Smart Locks, Smart Sensors and Detectors, and More), Connectivity Technology (Wi-Fi, Bluetooth, and More), Installation Type (Do-It-Yourself (DIY) and Professional), Sales Channel (Online, Offline - Specialty Stores, and Offline - Mass Retail and Home-Improvement Stores), and Geography. The Market Forecasts are Provided in Terms of Value (USD).
Global Smart Home Safety Market Trends and Insights
Rapid Decline in Sensor and Camera ASPs
Due to oversupply in legacy semiconductor lines, component costs for motion, smoke, and CO sensors continue to fall, letting manufacturers position full entry-level kits below USD 200 while preserving margins through subscription monitoring. Platform vendors respond by bundling predictive analytics subscriptions that lift lifetime customer value. These dynamics broaden the Smart Home Safety market beyond premium households, with emerging-economy retailers now offering starter kits through micro-financing models. Hardware commoditization is simultaneously pushing incumbents toward software differentiation and service revenues. The resulting deflationary pressure remains a decisive tailwind for the Smart Home Safety market.
Surge in Insurance-Partnered Discounts
Property insurers increasingly treat real-time sensor data as actuarial gold. State Farm, Liberty Mutual, and other carriers provide equipment subsidies or 5%-20% premium reductions in exchange for data feeds that verify device status. These programs shorten payback periods to as little as three years and create recurring sales funnels for device makers and professional installers. The virtuous cycle deepens as lower claim ratios validate actuarial modeling, prompting insurers to expand incentives to new product classes such as water-leak sensors and aging-in-place monitors.
High Upfront Device and Installation Cost
Although hardware is cheaper, full-suite smart safety packages with professional installation still start near USD 900, with monitoring fees adding USD 25-USD 50 monthly. Cost sensitivity delays uptake among lower-income homeowners and renters. Tariff-linked price increases on Chinese imports amplify sticker shock, even as insurers partially offset expenditures with premium credits. Vendors respond by offering hardware-as-a-service bundles that spread costs over multi-year contracts-a model emulating mobile phone plans-to keep the Smart Home Safety market accessible.
Other drivers and restraints analyzed in the detailed report include:
- Integration with Voice Assistants and Home Hubs
- Rising Burglary and Fire Incidents in Urban Areas
- Cyber-Vulnerability and Privacy Concerns
For complete list of drivers and restraints, kindly check the Table Of Contents.
Segment Analysis
Smart sensors and detectors secured a 29.78% Smart Home Safety market share in 2025, anchored by building-code mandates for smoke and carbon-monoxide alarms. Integrated safety hubs, though smaller in revenue today, exhibit the highest momentum with a projected 18.74% CAGR through 2031 as households favor single-app control. Competitive positioning now hinges on AI algorithms that fuse motion, acoustic, and temperature data into predictive alerts. Vendors diversify revenue by linking hubs to premium cloud analytics, reinforcing service-centric business models in the Smart Home Safety market.
Convergence trends place smart cameras, locks, and environmental monitors behind unified interfaces, expanding hub attach rates. Matter-compliant devices reassure buyers about forward compatibility, encouraging multi-device bundles that lift average selling prices. As hubs relay real-time diagnostics to insurers, claims processing times fall, creating feedback loops that drive further installations. Niche devices-such as smart glass break sensors-remain nascent but gain traction in commercial-residential hybrid properties keen on high security. Overall, resilient volume growth in foundational sensors guarantees baseline demand, while hubs capture disproportionate profit pools within the Smart Home Safety market.
Wi-Fi accounted for 56.85% of the Smart Home Safety market size in 2025, due to near-universal home router penetration that simplifies onboarding. However, bandwidth contention and power draw limitations spur migration to Thread, which is forecast to expand at an 18.21% CAGR. Thread 1.4 bolsters star-mesh topologies, allowing battery-powered sensors to self-heal network paths without proprietary gateways. Zigbee remains relevant in professionally installed projects that prioritize interference resilience, while Z-Wave's proprietary stack sees diminishing OEM support amid Matter convergence.
Multi-protocol hubs now incorporate Wi-Fi 6 for high-definition video, Thread for low-power peripherals, and cellular failover for redundancy. Vendors emphasize seamless roaming between 2.4 GHz and 6 GHz bands to reduce latency for emergency signals. As broadband providers ship Wi-Fi 7 routers with integrated Thread border routers, interoperability hurdles continue to fall, widening the addressable base of the Smart Home Safety market.
Complete Report Scope:
- By Device Type
- Smart Alarms
- Smart Locks
- Smart Sensors and Detectors
- Smart Cameras and Monitoring Systems
- Integrated Safety Hubs
- Other Device Types
- By Connectivity Technology
- Wi-Fi
- Bluetooth
- Zigbee
- Z-Wave
- Thread
- Cellular/LTE
- Other Connectivity
- By Installation Type
- Do-It-Yourself (DIY)
- Professional
- By Sales Channel
- Online
- Offline - Specialty Stores
- Offline - Mass Retail and Home-Improvement Stores
- By Geography
- North America
- United States
- Canada
- Mexico
- South America
- Brazil
- Argentina
- Chile
- Rest of South America
- Europe
- Germany
- United Kingdom
- France
- Italy
- Spain
- Russia
- Rest of Europe
- Asia-Pacific
- China
- India
- Japan
- South Korea
- Singapore
- Malaysia
- Australia
- Rest of Asia-Pacific
- Middle East and Africa
- Middle East
- United Arab Emirates
- Saudi Arabia
- Turkey
- Rest of Middle East
- Africa
- South Africa
- Nigeria
- Rest of Africa
- Middle East
- North America
Geography Analysis
North America retained 39.25% Smart Home Safety market share in 2025, supported by entrenched monitoring subscriptions and aggressive carrier-insurance collaborations that subsidize hardware. Federal energy standards increasingly reference connected safety devices as acceptable paths for compliance, creating indirect regulatory pull. Margins remain healthy despite tariff headwinds because premium service revenues offset hardware inflation. Canada follows similar patterns, while Mexico leverages near-shoring trends to attract device assembly investments that lower domestic prices.
Asia-Pacific is the fastest-growing region, advancing at an 18.45% CAGR through 2031. Japan pioneers aging-in-place programs that reimburse families for AI-equipped monitoring packages. China scales mass-market deployments through municipal smart-city budgets, though global vendors face data-sovereignty regulations that necessitate local data centers. India and Southeast Asia benefit from rising smartphone penetration and fintech-enabled micro-installment plans that spread hardware costs. Australia and Singapore adopt premium biometrics early, setting benchmarks that gradually diffuse regionally.
Europe balances privacy rules with retrofit mandates. The Energy Performance of Buildings Directive ties public funding to the integration of energy-saving and safety technologies, channeling capital toward bundled IoT packages. Germany's technical standards institution formalizes guidelines for interoperable smoke detectors, whereas the UK deploys community-oriented grants that fund neighborhood camera networks. Southern European markets accelerate late-cycle growth as EU cohesion funds underwrite apartment-block renovations that include connected alarms. Eastern Europe attracts contract manufacturers with competitive labor costs, positioning the sub-region as an export base for the broader Smart Home Safety market.
- ADT Inc.
- Amazon Ring LLC
- Google Nest Labs LLC
- Simplisafe Inc.
- Vivint Smart Home Inc.
- Frontpoint Security Solutions LLC
- Abode Systems Inc.
- CPI Security Systems Inc.
- Johnson Controls International plc
- Honeywell International Inc.
- Hangzhou Hikvision Digital Technology Co. Ltd.
- Arlo Technologies Inc.
- Netatmo (SA Legrand)
- August Home Inc. (Assa Abloy AB)
- Yale Commercial Locks and Hardware
- Kwikset (Spectrum Brands Holdings Inc.)
- Bosch Smart Home GmbH
- Alarm.com Holdings Inc.
- Brinks Home Security
- Wyze Labs Inc.
- Eufy Security (Anker Innovations Ltd.)
- Kangaroo Security Inc.
- Canary Connect Inc.
- Swann Communications Pty Ltd
- TP-Link Technologies Co. Ltd. (Tapo)
Additional Benefits:
- The market estimate (ME) sheet in Excel format
- 3 months of analyst support
TABLE OF CONTENTS
1 INTRODUCTION
- 1.1 Study Assumptions and Market Definition
- 1.2 Scope of the Study
2 RESEARCH METHODOLOGY
3 EXECUTIVE SUMMARY
4 MARKET LANDSCAPE
- 4.1 Market Overview
- 4.2 Market Drivers
- 4.2.1 Rapid decline in sensor and camera ASPs
- 4.2.2 Surge in insurance-partnered discounts
- 4.2.3 Integration with voice assistants and home hubs
- 4.2.4 Rising burglary and fire incidents in urban areas
- 4.2.5 Mandated remote home-care monitoring in ageing nations
- 4.2.6 EU energy-efficiency retrofit funds bundling safety IoT
- 4.3 Market Restraints
- 4.3.1 High upfront device and installation cost
- 4.3.2 Cyber-vulnerability and privacy concerns
- 4.3.3 Radio-spectrum congestion in dense smart-cities
- 4.3.4 Low-income rental regulations limiting fixture changes
- 4.4 Industry Value Chain Analysis
- 4.5 Regulatory Landscape
- 4.6 Technological Outlook
- 4.7 Industry Attractiveness - Porter's Five Forces Analysis
- 4.7.1 Bargaining Power of Suppliers
- 4.7.2 Bargaining Power of Buyers
- 4.7.3 Threat of New Entrants
- 4.7.4 Threat of Substitutes
- 4.7.5 Intensity of Competitive Rivalry
- 4.8 Impact of Macroeconomic Factors on the Market
5 MARKET SIZE AND GROWTH FORECASTS (VALUES)
- 5.1 By Device Type
- 5.1.1 Smart Alarms
- 5.1.2 Smart Locks
- 5.1.3 Smart Sensors and Detectors
- 5.1.4 Smart Cameras and Monitoring Systems
- 5.1.5 Integrated Safety Hubs
- 5.1.6 Other Device Types
- 5.2 By Connectivity Technology
- 5.2.1 Wi-Fi
- 5.2.2 Bluetooth
- 5.2.3 Zigbee
- 5.2.4 Z-Wave
- 5.2.5 Thread
- 5.2.6 Cellular/LTE
- 5.2.7 Other Connectivity
- 5.3 By Installation Type
- 5.3.1 Do-It-Yourself (DIY)
- 5.3.2 Professional
- 5.4 By Sales Channel
- 5.4.1 Online
- 5.4.2 Offline - Specialty Stores
- 5.4.3 Offline - Mass Retail and Home-Improvement Stores
- 5.5 By Geography
- 5.5.1 North America
- 5.5.1.1 United States
- 5.5.1.2 Canada
- 5.5.1.3 Mexico
- 5.5.2 South America
- 5.5.2.1 Brazil
- 5.5.2.2 Argentina
- 5.5.2.3 Chile
- 5.5.2.4 Rest of South America
- 5.5.3 Europe
- 5.5.3.1 Germany
- 5.5.3.2 United Kingdom
- 5.5.3.3 France
- 5.5.3.4 Italy
- 5.5.3.5 Spain
- 5.5.3.6 Russia
- 5.5.3.7 Rest of Europe
- 5.5.4 Asia-Pacific
- 5.5.4.1 China
- 5.5.4.2 India
- 5.5.4.3 Japan
- 5.5.4.4 South Korea
- 5.5.4.5 Singapore
- 5.5.4.6 Malaysia
- 5.5.4.7 Australia
- 5.5.4.8 Rest of Asia-Pacific
- 5.5.5 Middle East and Africa
- 5.5.5.1 Middle East
- 5.5.5.1.1 United Arab Emirates
- 5.5.5.1.2 Saudi Arabia
- 5.5.5.1.3 Turkey
- 5.5.5.1.4 Rest of Middle East
- 5.5.5.2 Africa
- 5.5.5.2.1 South Africa
- 5.5.5.2.2 Nigeria
- 5.5.5.2.3 Rest of Africa
- 5.5.5.1 Middle East
- 5.5.1 North America
6 COMPETITIVE LANDSCAPE
- 6.1 Market Concentration
- 6.2 Strategic Moves
- 6.3 Market Share Analysis
- 6.4 Company Profiles (includes Global level Overview, Market level overview, Core Segments, Financials as available, Strategic Information, Market Rank/Share for key companies, Products and Services, and Recent Developments)
- 6.4.1 ADT Inc.
- 6.4.2 Amazon Ring LLC
- 6.4.3 Google Nest Labs LLC
- 6.4.4 Simplisafe Inc.
- 6.4.5 Vivint Smart Home Inc.
- 6.4.6 Frontpoint Security Solutions LLC
- 6.4.7 Abode Systems Inc.
- 6.4.8 CPI Security Systems Inc.
- 6.4.9 Johnson Controls International plc
- 6.4.10 Honeywell International Inc.
- 6.4.11 Hangzhou Hikvision Digital Technology Co. Ltd.
- 6.4.12 Arlo Technologies Inc.
- 6.4.13 Netatmo (SA Legrand)
- 6.4.14 August Home Inc. (Assa Abloy AB)
- 6.4.15 Yale Commercial Locks and Hardware
- 6.4.16 Kwikset (Spectrum Brands Holdings Inc.)
- 6.4.17 Bosch Smart Home GmbH
- 6.4.18 Alarm.com Holdings Inc.
- 6.4.19 Brinks Home Security
- 6.4.20 Wyze Labs Inc.
- 6.4.21 Eufy Security (Anker Innovations Ltd.)
- 6.4.22 Kangaroo Security Inc.
- 6.4.23 Canary Connect Inc.
- 6.4.24 Swann Communications Pty Ltd
- 6.4.25 TP-Link Technologies Co. Ltd. (Tapo)
7 MARKET OPPORTUNITIES AND FUTURE TRENDS
- 7.1 White-Space and Unmet-Need Assessment

