PUBLISHER: Mordor Intelligence | PRODUCT CODE: 2123490

PUBLISHER: Mordor Intelligence | PRODUCT CODE: 2123490
White Oil - Market Share Analysis, Industry Trends & Statistics, Growth Forecasts (2026 - 2031)
According to Mordor Intelligence, the white oil market size is expected to grow from 1.56 Million tons in 2025 to 1.58 Million tons in 2026 and is forecast to reach 1.69 Million tons by 2031 at 1.36% CAGR over 2026-2031.
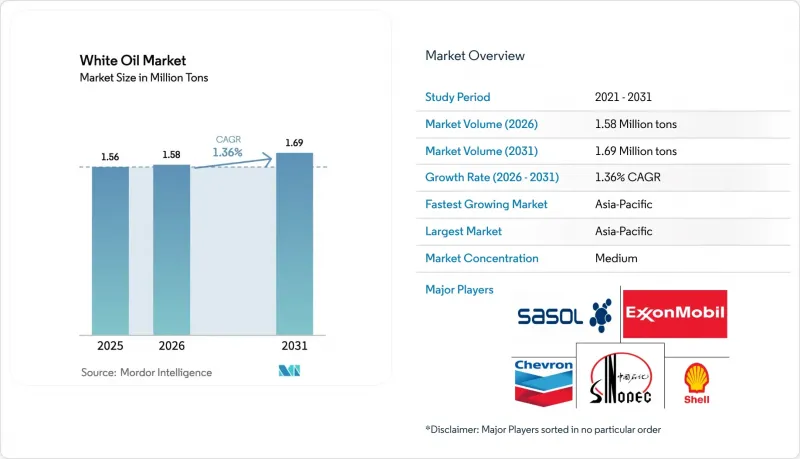
This report is Segmented by Grade (Technical/Industrial and Pharmaceutical), Base-Oil (Group II, Group I, Group III, and Naphthenic), Viscosity (Low, Medium, and High), Application (Personal Care, Plastics and Elastomers, and More), and Geography (Asia-Pacific, North America, Europe, South America, and Middle-East and Africa). The Market Forecasts are Provided in Terms of Volume (Tons).
Global White Oil Market Trends and Insights
Surge in Asia-Pacific Biologics Fill-Finish Lines Demanding USP-Grade White Oils
Biologics capacity additions in China and India exceeded 50 new fill-finish sites between 2024 and 2025. Each line specifies white oils with endotoxin below 0.25 EU/mL and PAH below 3%, criteria that exclude legacy Group I streams while favoring hydrocracked outputs. Contract manufacturers serving Western biosimilar demand impose FDA-aligned documentation, so suppliers providing real-time batch analytics win long-term contracts. The trend lifts volumes of premium low-viscosity grades and compresses margins for commodity blenders that lack pharmaceutical validation.
Europe MOAH/MOSH Limits Accelerating Shift to Food-Grade White Oils in Packaging
Converters of flexible packaging are adopting hydrogenated white oils certified under FDA 21 CFR 178.3620(a) after EFSA confirmed MOAH migration above 2 mg/kg in dry foods. Brand owners pay EUR 200-300 per ton premiums for certified lots, yet smaller suppliers struggle to absorb third-party testing costs. Rapid compliance cycles mean specialty refiners with in-house GC-FID capability secure volume gains.
EU Micro-Plastic Directive Curbing Mineral-Oil-Based Cosmetic Formulations
Regulation 2023/2055 restricts synthetic polymer microparticles in rinse-off cosmetics, prompting European brands to substitute mineral-oil carriers with plant-derived esters to avoid petrochemical labeling. Although mineral oils are not microplastics, consumer perception drove a 3-4% decline in regional personal-care demand during 2025. Reformulation cycles average 18-24 months, so most substitution will conclude by 2027.
Other drivers and restraints analyzed in the detailed report include:
- Indian Ayurvedic-Cosmetics Boom Fuelling Light-Paraffinic White-Oil Usage
- Expansion in Polymer and Plastic Processing in Emerging Economies
- North American Infant-Food Players Pivoting to Bio-Based Esters
For complete list of drivers and restraints, kindly check the Table Of Contents.
Segment Analysis
Pharmaceutical grade held 66.23% of 2025 volume, underlining entrenched regulatory moats that discourage new entrants. The segment grows at a 1.32% CAGR, reflecting mature demand rooted in chronic-care and dermatology formulations. Batch-to-batch viscosity must remain within +-0.5 cSt, and heavy metals stay below 1 ppm, requirements that raise compliance costs. Technical-grade volumes rise faster in plastics and adhesives where cost trumps purity, but lack of pharmacopoeial coverage limits their conversion into higher-margin channels.
Second-order effects concentrate on the procurement side. Leading pharmaceutical firms now demand blockchain-enabled traceability that tracks drum numbers to refinery runs, reducing supply flexibility for smaller blenders. Meanwhile, industrial users tolerate wider viscosity bands, enabling discount suppliers to survive on price plays. The segmentation thus preserves a two-tier structure that insulates incumbents yet caps growth potential. The white oil industry maintains this divide by reinvesting in analytical labs rather than new distillation hardware.
Group II captured 67.12% of volume in 2025 and is progressing at a 1.73% CAGR, fuelled by sulfur-free outputs that align with European food-contact directives. In 2025, Group III remained a niche premium option with higher oxidative stability premiums. Group I volumes erode in pharmaceutical and food uses but continue in adhesives where cost pressures dominate.
Integrated refiners use swing units to toggle between fuels and specialty outputs. When marine-fuel margins spiked after IMO 2020, paraffinic feedstocks diverted away from white oils, lifting spot prices by 6-8%. Despite this volatility, Group II capacity additions on the U.S. Gulf Coast and in China reaffirm long-term supply security. Group III opportunities lie in injectable-drug devices and high-temperature metalworking fluids, yet price elasticity tempers adoption. The white oil market continues to migrate toward hydrocracked purity, an irreversible shift for regulated sectors.
Complete Report Scope:
- By Grade
- Pharmaceutical
- Technical/Industrial
- By Base-Oil
- Group II
- Group I
- Group III
- Naphthenic
- By Viscosity
- Low
- Medium
- High
- By Application
- Personal Care
- Plastics and Elastomers
- Adhesives
- Pharmaceuticals
- Food and Beverage
- Agriculture
- Textile
- Metalworking Applications
- Other Applications (Household Products)
- By Geography
- Asia-Pacific
- China
- India
- Japan
- South Korea
- ASEAN Countries
- Rest of Asia-Pacific
- North America
- United States
- Canada
- Mexico
- Europe
- Germany
- United Kingdom
- Italy
- France
- NORDIC Countries
- Rest of Europe
- South America
- Brazil
- Argentina
- Rest of South America
- Middle-East and Africa
- Saudi Arabia
- South Africa
- Rest of Middle-East and Africa
- Asia-Pacific
Geography Analysis
Asia-Pacific anchored 63.44% of volume in 2025, yet its 1.35% forecast CAGR lags personal-care growth, showing that bulk polymer processing is plateauing. China contributes major consumption through pharmaceutical clusters in Jiangsu and plastics bases in Guangdong, but stricter refinery emission targets limit incremental capacity. India emerges as the fastest-growing node, benefiting from Ayurvedic cosmetics, domestic drug production, and polymer expansions in Gujarat. Southeast Asian economies, notably Vietnam and Thailand, upscale white-oil imports for flexible packaging and food handling, though freight volatility introduces procurement risk.
In North America, U.S. pharmaceutical excipient standards shield demand for USP-grade lots, yet bio-based substitutions in infant food and microplastic-driven cosmetic reformulations curtail upside. Canada's reliance on imports sustains steady buying but lacks internal refining upgrades. Mexico's growth hinges on technical-grade needs from rising auto parts and packaging output. Regulatory complexity lengthens product-qualification cycles, favoring incumbents.
Europe's demand is shaped by food-contact reforms and antiplastics sentiment. Germany leads adoption of premium food-grade oils in packaging, offsetting weaker personal-care call-offs. United Kingdom and France mirror this pattern, while Nordic countries progress faster toward bio-alternatives. Southern Europe sustains mineral-oil legacy formulas in cosmetics and processed foods but faces harmonization by 2028. The Middle-East and Africa combined account for a smaller share, driven by GCC pharmaceutical ambitions and South African industrial lubricants, yet political risk and infrastructure gaps temper immediate growth. Collectively, regional dynamics underscore that the white oil market growth story rests on regulated purity upgrades rather than sheer volume expansion.
- Apar Industries Ltd.
- Asian Oil Company
- BP p.l.c
- Brenntag SE
- Calumet, Inc.
- Chevron Corporation
- China Petroleum & Chemical Corporation
- Exxon Mobil Corporation
- Gandhar Oil Refinery (India) Limited
- Gazpromneft - Lubricants Ltd.
- H&R GROUP
- HF Sinclair Corporation
- Indorama Ventures Public Company Limited
- LANXESS
- Nynas AB
- PetroChina Company Limited
- RENKERT OIL
- Sasol
- SAVITA OIL TECHNOLOGIES LIMITED
- SEOJIN CHEMICAL CO.,LTD.
- Shell plc
- Sonneborn LLC
- TotalEnergies
Additional Benefits:
- The market estimate (ME) sheet in Excel format
- 3 months of analyst support
TABLE OF CONTENTS
1 Introduction
- 1.1 Study Assumptions and Market Definition
- 1.2 Scope of the Study
2 Research Methodology
3 Executive Summary
4 Market Landscape
- 4.1 Market Overview
- 4.2 Market Drivers
- 4.2.1 Surge In Asia-Pacific Biologics Fill-Finish Lines Demanding USP-Grade White Oils
- 4.2.2 Europe MOAH/MOSH Limits Accelerating Shift to Food-Grade White Oils in Packaging
- 4.2.3 Indian Ayurvedic-Cosmetics Boom Fuelling Light-Paraffinic White-Oil Usage
- 4.2.4 Expansion in Polymer and Plastic Processing in Emerging Economies
- 4.2.5 GCC Pharma Capacity Build-Out Boosting Imports of High-Purity Grades
- 4.3 Market Restraints
- 4.3.1 EU Micro-Plastic Directive Curbing Mineral-Oil-Based Cosmetic Formulations
- 4.3.2 North American Infant-Food Players Pivoting To Bio-Based Esters
- 4.3.3 IMO-2020 Sulfur Caps Tightening High-Quality Feedstock Supply
- 4.4 Value Chain Analysis
- 4.5 Porter's Five Forces
- 4.5.1 Bargaining Power of Suppliers
- 4.5.2 Bargaining Power of Buyers
- 4.5.3 Threat of New Entrants
- 4.5.4 Threat of Substitutes
- 4.5.5 Competitive Rivalry
- 4.6 Distribution Channel Analysis
- 4.7 Factors Affecting Purchase Decisions
5 Market Size and Growth Forecasts (Volume)
- 5.1 By Grade
- 5.1.1 Pharmaceutical
- 5.1.2 Technical/Industrial
- 5.2 By Base-Oil
- 5.2.1 Group II
- 5.2.2 Group I
- 5.2.3 Group III
- 5.2.4 Naphthenic
- 5.3 By Viscosity
- 5.3.1 Low
- 5.3.2 Medium
- 5.3.3 High
- 5.4 By Application
- 5.4.1 Personal Care
- 5.4.2 Plastics and Elastomers
- 5.4.3 Adhesives
- 5.4.4 Pharmaceuticals
- 5.4.5 Food and Beverage
- 5.4.6 Agriculture
- 5.4.7 Textile
- 5.4.8 Metalworking Applications
- 5.4.9 Other Applications (Household Products)
- 5.5 By Geography
- 5.5.1 Asia-Pacific
- 5.5.1.1 China
- 5.5.1.2 India
- 5.5.1.3 Japan
- 5.5.1.4 South Korea
- 5.5.1.5 ASEAN Countries
- 5.5.1.6 Rest of Asia-Pacific
- 5.5.2 North America
- 5.5.2.1 United States
- 5.5.2.2 Canada
- 5.5.2.3 Mexico
- 5.5.3 Europe
- 5.5.3.1 Germany
- 5.5.3.2 United Kingdom
- 5.5.3.3 Italy
- 5.5.3.4 France
- 5.5.3.5 NORDIC Countries
- 5.5.3.6 Rest of Europe
- 5.5.4 South America
- 5.5.4.1 Brazil
- 5.5.4.2 Argentina
- 5.5.4.3 Rest of South America
- 5.5.5 Middle-East and Africa
- 5.5.5.1 Saudi Arabia
- 5.5.5.2 South Africa
- 5.5.5.3 Rest of Middle-East and Africa
- 5.5.1 Asia-Pacific
6 Competitive Landscape
- 6.1 Market Concentration
- 6.2 Strategic Moves
- 6.3 Market Share(%)/Ranking Analysis
- 6.4 Company Profiles (includes Global-level Overview, Market-level Overview, Core Segments, Financials, Strategic Information, Products and Services, Recent Developments)
- 6.4.1 Apar Industries Ltd.
- 6.4.2 Asian Oil Company
- 6.4.3 BP p.l.c
- 6.4.4 Brenntag SE
- 6.4.5 Calumet, Inc.
- 6.4.6 Chevron Corporation
- 6.4.7 China Petroleum & Chemical Corporation
- 6.4.8 Exxon Mobil Corporation
- 6.4.9 Gandhar Oil Refinery (India) Limited
- 6.4.10 Gazpromneft - Lubricants Ltd.
- 6.4.11 H&R GROUP
- 6.4.12 HF Sinclair Corporation
- 6.4.13 Indorama Ventures Public Company Limited
- 6.4.14 LANXESS
- 6.4.15 Nynas AB
- 6.4.16 PetroChina Company Limited
- 6.4.17 RENKERT OIL
- 6.4.18 Sasol
- 6.4.19 SAVITA OIL TECHNOLOGIES LIMITED
- 6.4.20 SEOJIN CHEMICAL CO.,LTD.
- 6.4.21 Shell plc
- 6.4.22 Sonneborn LLC
- 6.4.23 TotalEnergies
7 Market Opportunities and Future Outlook
- 7.1 White-space and Unmet-Need Assessment

