PUBLISHER: Mordor Intelligence | PRODUCT CODE: 2124221

PUBLISHER: Mordor Intelligence | PRODUCT CODE: 2124221
India Smart TV And OTT - Market Share Analysis, Industry Trends & Statistics, Growth Forecasts (2026 - 2031)
According to Mordor Intelligence, the India smart TV and OTT market size was valued at USD 22.39 billion in 2025 and estimated to grow from USD 26.39 billion in 2026 to reach USD 60.05 billion by 2031, at a CAGR of 17.88% during the forecast period (2026-2031).
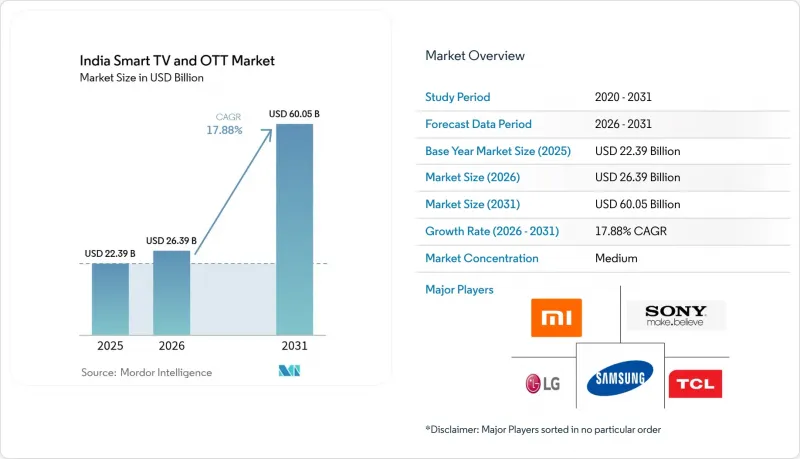
This report is Segmented by OS Platform (Android TV, Proprietary Linux, Fire OS, Indos), Price Band (60k INR), Screen Size (<=32", 33-43", 44-55", >55"), Distribution Channel (Online, Organised Retail, Independent Dealers), and Geography (National Coverage). The Market Forecasts are Provided in Terms of Value (USD).
India Smart TV And OTT Market Trends and Insights
Rising Disposable Income and Digital Adoption
Rural internet users crossed 442 million in 2024, overtaking the urban base for the first time and signalling deeper addressable demand for the India smart TV and OTT market. Multidimensional poverty fell to 14.96% in 2019-21, freeing household budgets for long-life consumer electronics. Government-run PMGDISHA trained nearly 64 million citizens in basic digital skills, lowering entry barriers to smart TV features. Average monthly wireless data use reached 21.30 GB per subscriber at a tariff of INR 8.31 per GB, down from INR 268.97 ten years earlier, making HD and 4K streaming an everyday habit. These socioeconomic shifts underpin consistent multi-year growth momentum for the India smart TV and OTT market.
Falling Smart-TV ASPs and PLI Manufacturing Incentives
PLI reimbursements offset volatile panel prices, allowing brands to hold entry prices even as open-cell costs swung 20% since late-2023. Dixon Technologies' USD 600 million expansion into display modules anchors a broader supplier ecosystem that now includes Korean component vendors investing INR 1,200 crore to localize inputs. The February 2025 Union Budget trimmed customs duty on open cells to zero and preserved a lower slab for smaller screens, preserving cost competitiveness despite a 28% GST on TVs larger than 32 inches. These fiscal tailwinds let manufacturers price aggressively without eroding already thin 4-7% operating margins, sustaining volume-led growth in the India smart TV and OTT market.
High GST and Customs Duties on Panels
The 28% GST slab on televisions beyond 32 inches steers buyers toward tax-efficient smaller screens even though living-room habits favor bigger displays. Customs duty on interactive panels rose to 20% in Budget 2025-26, squeezing education and commercial segments that often ignite volume scale. Compliance testing under IS 616:2017 adds weeks to launch cycles and compounds cost pressure as brands juggle multiple bureau approvals. These fiscal and procedural frictions slow premium uptake and shave points off the India smart TV and OTT market CAGR until duty rationalization gains momentum.
Other drivers and restraints analyzed in the detailed report include:
- Broadband Data Boom and 5G Roll-outs
- Content Localisation in 12+ Languages
- Piracy and Password Sharing
For complete list of drivers and restraints, kindly check the Table Of Contents.
Segment Analysis
Android TV accounted for a dominant 67.38% of the India smart TV and OTT market share in 2025, yet IndOS shipments are forecast to grow at a 26.85% CAGR through 2031 as state procurement and data-sovereignty preferences take hold. This transition is supported by JioTele OS, launched in February 2025, which bundles voice AI and smart-home dashboards optimized for Indic languages. Over the forecast horizon, the India smart TV and OTT market size attached to IndOS devices is set to expand rapidly, providing domestic OEMs a strategic wedge against entrenched global platforms.
Developers recognize commercial upside in localized storefronts, while regulators prefer transparent code audits that IndOS can facilitate. Nonetheless, sustained user experience parity with Android TV's vast app library remains a gating factor. Fire OS keeps a niche by pairing Amazon content and retail wallets, Tizen and webOS preserve value at the premium end through deep hardware-software integration, and Linux derivatives power economical white-label models. The resulting multi-platform landscape intensifies feature innovation and price competition across the India smart TV and OTT market.
Televisions priced between 20,000-40,000 INR delivered 41.60% of the India smart TV and OTT market size in 2025, but units costing over 60,000 INR are projected to clock a 23.70% CAGR to 2031 as household incomes climb. Larger living spaces and demand for advanced display technologies such as QLED and OLED underpin this upward migration. Samsung's Chennai expansion aligns capacity with premium appetite, while Xiaomi, TCL, and OnePlus seek to stretch mid-range DNA upward without losing price sensitivity.
Margin pressure plagues the sub-20,000 INR tier because open-cell prices still represent 60-65% of the bill-of-materials. Domestic fabrication of panels by Dixon eases dependency on imports, allowing local brands to widen feature sets without proportionate cost hikes. The 40,000-60,000 INR tranche emerges as a transitional sweet spot where HDR, Dolby Atmos, and 120 Hz refresh rates become affordable luxury. As consumers increasingly treat smart TVs as eight-year assets rather than discretionary gadgets, their willingness to pay a premium for longevity fuels the India smart TV and OTT market.
Complete Report Scope:
- By OS Platform
- Android TV
- Proprietary Linux (Tizen/WebOS)
- Fire OS
- IndOS (Gov-backed)
- By Price Band (INR)
- < 20 k
- 20 k - 40 k
- 40 k - 60 k
- > 60 k
- By Screen Size
- <=32"
- 33 - 43"
- 44 - 55"
- > 55"
- By Distribution Channel
- Online (e-commerce)
- Organised Retail
- Independent Dealers
List of Companies Covered in this Report:
- Xiaomi Corporation
- Samsung Electronics Co., Ltd.
- LG Electronics Inc.
- Sony Group Corporation
- TCL Technology Group Corp.
- VU Technologies Private Ltd.
- Honor Device Co., Ltd.
- Panasonic Holdings Corp.
- Haier Smart Home Co., Ltd.
- OnePlus Technology (Shenzhen) Co., Ltd.
- Sansui Electric Co., Ltd.
- Realme Mobile Telecommunications (Shenzhen) Co., Ltd.
- Hisense Visual Technology Co., Ltd.
- Koninklijke Philips N.V.
- Skyworth Group Co., Ltd.
- Super Plastronics Pvt. Ltd.
- TPV Technology Limited
- Mirc Electronics Limited
- Infinix Mobility Limited
- Acer Incorporated (via Indkal Technologies Pvt. Ltd.)
- BPL Limited
Additional Benefits:
- The market estimate (ME) sheet in Excel format
- 3 months of analyst support
TABLE OF CONTENTS
1 INTRODUCTION
- 1.1 Study Assumptions and Market Definition
- 1.2 Scope of the Study
2 RESEARCH METHODOLOGY
3 EXECUTIVE SUMMARY
4 MARKET LANDSCAPE
- 4.1 Market Overview
- 4.2 Market Drivers
- 4.2.1 Rising disposable income and digital adoption
- 4.2.2 Falling smart-TV ASPs and PLI manufacturing incentives
- 4.2.3 Broadband data boom and 5G roll-outs
- 4.2.4 Content localisation in 12+ languages
- 4.2.5 Mandatory India TV OS (IndOS) standard (under-reported)
- 4.2.6 Super-app bundling of OTT + e-commerce (under-reported)
- 4.3 Market Restraints
- 4.3.1 High GST (28 %) and customs duties on panels
- 4.3.2 Piracy and password sharing
- 4.3.3 Rural grid-power unreliability (under-reported)
- 4.3.4 5 G spectrum cost overhang (under-reported)
- 4.4 Industry Value-Chain Analysis
- 4.5 Regulatory Landscape
- 4.6 Technological Outlook
- 4.7 Porter's Five Forces Analysis
- 4.7.1 Threat of New Entrants
- 4.7.2 Bargaining Power of Buyers
- 4.7.3 Bargaining Power of Suppliers
- 4.7.4 Threat of Substitutes
- 4.7.5 Competitive Rivalry
5 MARKET SIZE AND GROWTH FORECASTS
- 5.1 By OS Platform
- 5.1.1 Android TV
- 5.1.2 Proprietary Linux (Tizen/WebOS)
- 5.1.3 Fire OS
- 5.1.4 IndOS (Gov-backed)
- 5.2 By Price Band (INR)
- 5.2.1 < 20 k
- 5.2.2 20 k - 40 k
- 5.2.3 40 k - 60 k
- 5.2.4 > 60 k
- 5.3 By Screen Size
- 5.3.1 <=32"
- 5.3.2 33 - 43"
- 5.3.3 44 - 55"
- 5.3.4 > 55"
- 5.4 By Distribution Channel
- 5.4.1 Online (e-commerce)
- 5.4.2 Organised Retail
- 5.4.3 Independent Dealers
6 COMPETITIVE LANDSCAPE
- 6.1 Market Concentration
- 6.2 Strategic Moves
- 6.3 Market Share Analysis
- 6.4 Company Profiles (includes Global level Overview, Market level overview, Core Segments, Financials as available, Strategic Information, Market Rank/Share for key companies, Products and Services, and Recent Developments)
- 6.4.1 Xiaomi Corporation
- 6.4.2 Samsung Electronics Co., Ltd.
- 6.4.3 LG Electronics Inc.
- 6.4.4 Sony Group Corporation
- 6.4.5 TCL Technology Group Corp.
- 6.4.6 VU Technologies Private Ltd.
- 6.4.7 Honor Device Co., Ltd.
- 6.4.8 Panasonic Holdings Corp.
- 6.4.9 Haier Smart Home Co., Ltd.
- 6.4.10 OnePlus Technology (Shenzhen) Co., Ltd.
- 6.4.11 Sansui Electric Co., Ltd.
- 6.4.12 Realme Mobile Telecommunications (Shenzhen) Co., Ltd.
- 6.4.13 Hisense Visual Technology Co., Ltd.
- 6.4.14 Koninklijke Philips N.V.
- 6.4.15 Skyworth Group Co., Ltd.
- 6.4.16 Super Plastronics Pvt. Ltd.
- 6.4.17 TPV Technology Limited
- 6.4.18 Mirc Electronics Limited
- 6.4.19 Infinix Mobility Limited
- 6.4.20 Acer Incorporated (via Indkal Technologies Pvt. Ltd.)
- 6.4.21 BPL Limited
7 MARKET OPPORTUNITIES AND FUTURE OUTLOOK

