PUBLISHER: Mordor Intelligence | PRODUCT CODE: 2124331

PUBLISHER: Mordor Intelligence | PRODUCT CODE: 2124331
Automation Testing - Market Share Analysis, Industry Trends & Statistics, Growth Forecasts (2026 - 2031)
According to Mordor Intelligence, the automation testing market size reached USD 40.44 billion in 2026 and is projected to attain USD 78.94 billion by 2031, reflecting a 14.32% CAGR across the forecast period.
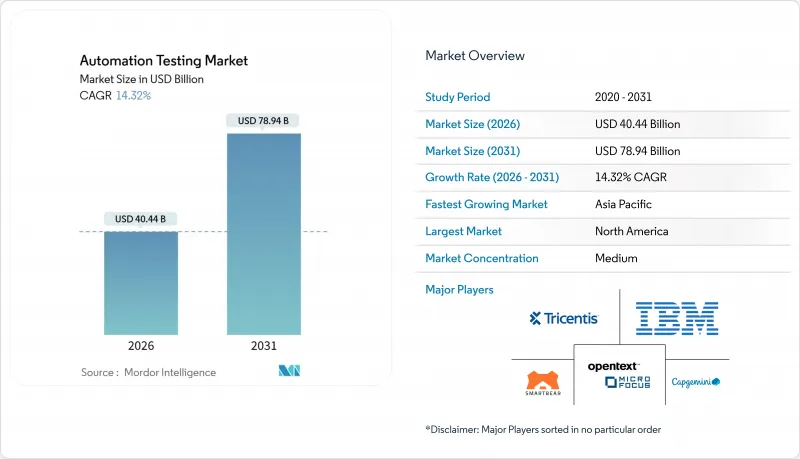
This report is Segmented by Component (Solutions, and Services), Testing Type (Functional, and Non-Functional), Deployment Mode (On-Premises, and Cloud), End-User Industry (IT and Telecommunications, BFSI, and More), Organization Size (Large Enterprises, and SMEs), Interface (Web, Mobile, and More), and Geography (North America, Europe, and More). The Market Forecasts are Provided in Terms of Value (USD).
Global Automation Testing Market Trends and Insights
Rising Adoption of Agile and DevOps for Continuous Testing
Organizations embed automated regression suites directly into continuous-integration pipelines, compressing release cycles from quarterly to weekly cadences. Microsoft reported a 43% year-over-year rise in parallel test jobs on Azure DevOps in 2025, indicating a shift from manual approvals toward policy-as-code gating. Higher delivery velocity narrows windows for exploratory testing, pushing teams to automate smoke, integration, and end-to-end scenarios once reserved for human judgment. Docker's 2024 survey noted that 68% of DevOps practitioners run automated tests on every commit, up from 51% a year earlier. As a result, test platforms integrate natively with Git repositories and observability stacks, surfacing defect telemetry in real time and creating demand for unified DevOps toolchains.
AI-Driven Test-Creation and Maintenance Tools
Generative AI turns natural-language requirements into executable scripts and self-heals selectors when UI elements change, trimming maintenance costs that historically consumed up to 40% of QA budgets. IBM's watsonx Code Assistant converts COBOL business logic into test cases for mainframe workloads. Tricentis folded natural-language authoring into its platform via the Waldo and Virtuoso acquisitions, enabling testers to describe scenarios in plain English and receive Selenium scripts in minutes. Applitools Visual AI flags pixel-level regressions and reduced false-positive alerts by 60% during pilot projects. These advances allow enterprises to expand coverage without proportional head-count growth, shifting QA engineers toward risk-based prioritization.
High Up-Front Tool and Skills Investment
Enterprise-grade frameworks require license fees, infrastructure provisioning, and staff upskilling, forming a capital barrier for SMEs. PwC's 2025 survey indicated 42% of smaller firms cite budget constraints as the chief obstacle to automated security testing. The talent gap compounds the hurdle, with LinkedIn's 2024 report showing demand for automation engineers outstripping supply by a factor of 2.3 in North America. Firms unable to fund competitive salaries or long-term subscriptions delay automation programs, perpetuating manual bottlenecks that slow releases and raise defect-escape rates.
Other drivers and restraints analyzed in the detailed report include:
- Expansion of Cloud-Native and Micro-Services Architectures
- Low-Code or No-Code Automation Democratizing QA
- Legacy-System Integration Complexity
For complete list of drivers and restraints, kindly check the Table Of Contents.
Segment Analysis
Solutions accounted for a 61.72% automation testing market share in 2025, reflecting enterprises' reliance on packaged functional, performance, and security modules that plug directly into DevOps pipelines. Services, however, are projected to capture the fastest-growth lane with a 15.23% CAGR through 2031 as buyers outsource script maintenance and hybrid-cloud integration to specialists, shifting quality assurance from fixed headcount to on-demand expertise. Managed providers update regression packs in lockstep with continuous-delivery sprints, shrinking lead times and freeing internal teams to focus on risk prioritization.
The automation testing market size tied to services is growing as regulatory audits demand traceability matrices, driving demand for consulting hours that map test cases to compliance clauses under the GDPR and ISO 13485. Vendors bundle advisory, framework tuning, and managed execution into outcome-based contracts, converting what once were capital purchases into operating expenses that scale with release velocity.
Functional suites retained a 58.33% market share in automation testing in 2025, confirming their foundational role in validating user workflows. Non-functional categories, performance, security, and accessibility are set to expand at a 16.94% CAGR, the fastest clip in this segmentation, as zero-trust architectures and WCAG 3 mandates elevate latency, vulnerability, and usability metrics to board-level risk registers.
Organizations integrate Apache JMeter load scripts and static-analysis scans into the same dashboards that track functional coverage, correlating service-level objectives with defect trends. As breaches and slow page loads inflict brand damage that exceeds functional defects, procurement teams allocate larger budgets to non-functional tooling, shifting the automation testing market size toward balanced spending across the two categories.
Complete Report Scope:
- By Component
- Solutions
- Functional Testing
- API Testing
- Security Testing
- Compliance Testing
- Usability Testing
- Load and Performance Testing
- Other Solutions
- Services
- Professional Services
- Managed Services
- Solutions
- By Testing Type
- Functional
- Non-Functional
- Performance
- Security
- Usability
- By Deployment Mode
- On-Premises
- Cloud
- Public
- Private
- Hybrid
- By End-User Industry
- IT and Telecommunications
- BFSI
- Healthcare and Life Sciences
- Retail and E-Commerce
- Transportation and Logistics
- Manufacturing
- Government and Public Sector
- Energy and Utilities
- Other End-User Industries
- By Organization Size
- Large Enterprises
- Small and Medium Enterprises
- By Interface
- Web
- Mobile
- Desktop
- API / Micro-Services
- IoT / Embedded
- By Geography
- North America
- United States
- Canada
- Mexico
- South America
- Brazil
- Argentina
- Rest of South America
- Europe
- Germany
- United Kingdom
- France
- Italy
- Spain
- Russia
- Rest of Europe
- Asia Pacific
- China
- Japan
- South Korea
- India
- Australia
- New Zealand
- Rest of Asia Pacific
- Middle East
- United Arab Emirates
- Saudi Arabia
- Turkey
- Rest of Middle East
- Africa
- South Africa
- Nigeria
- Kenya
- Rest of Africa
- North America
Geography Analysis
North America contributed 39.54% of the 2025 revenue, supported by mature DevOps adoption, federal accessibility mandates, and venture funding that accelerates the rollouts of AI-native platforms. United States enterprises integrate GitHub Copilot and IBM watsonx into pipelines, auto-generating unit and integration tests on every commit. Canadian banks automate regression checks to satisfy regulatory resilience guidelines, while Mexican manufacturers embed testing into supply-chain portals that exchange customs data with U.S. authorities.
Asia Pacific is projected to record the fastest expansion at a 16.13% CAGR through 2031. India's Digital Public Infrastructure programs demand validation of Aadhaar and UPI APIs at a national scale. China enforces PIPL data-sovereignty rules, prompting hybrid-cloud grids located within national borders. Japanese industrial conglomerates partner with HeadSpin device labs to vet automotive firmware across climate zones, and Australian agencies require WCAG-aligned testing for citizen portals, driving adoption of accessibility tools from Deque Systems and Applitools.
Europe maintains robust demand as the European Accessibility Act and GDPR converge, necessitating automated validation and data anonymization. German automakers test ADAS software under edge-latency scenarios, the United Kingdom's financial sector hires managed-service providers to automate disaster-recovery test runs, and French healthcare groups validate HL7 FHIR data exchanges under national digital-health initiatives. Middle East and Africa investment concentrates in smart-city and fintech platforms, while Latin American growth benefits from localization features in no-code tools that broaden SME participation.
- IBM Corporation
- OpenText Corporation (Micro Focus)
- Capgemini SE
- Tricentis USA Corp
- SmartBear Software Inc.
- Parasoft Corporation
- Cigniti Technologies Ltd.
- Keysight Technologies Inc.
- Sauce Labs Inc.
- Accenture plc
- Microsoft Corporation
- Katalon Inc.
- BrowserStack Inc.
- LambdaTest Inc.
- Leapwork A/S
- Applitools Ltd.
- Ranorex GmbH
- Worksoft Inc.
- Perfecto (Perforce Software Inc.)
- Functionize Inc.
- Testim.io Ltd.
- Virtuoso QA Ltd.
- Eggplant (Keysight)
- mabl Inc.
- HeadSpin Inc.
Additional Benefits:
- The market estimate (ME) sheet in Excel format
- 3 months of analyst support
TABLE OF CONTENTS
1 INTRODUCTION
- 1.1 Study Assumptions and Market Definition
- 1.2 Scope of the Study
2 RESEARCH METHODOLOGY
3 EXECUTIVE SUMMARY
4 MARKET LANDSCAPE
- 4.1 Market Overview
- 4.2 Market Drivers
- 4.2.1 Rising Adoption of Agile and DevOps for Continuous Testing
- 4.2.2 AI-Driven Test-Creation and Maintenance Tools
- 4.2.3 Expansion of Cloud-Native and Micro-Services Architectures
- 4.2.4 Low-Code or No-Code Automation Democratising QA
- 4.2.5 Digital-Accessibility Mandates (WCAG 3) Spurring Automated Accessibility Testing
- 4.2.6 On-Device Regression Needs for Edge and IoT Firmware
- 4.3 Market Restraints
- 4.3.1 High Up-Front Tool and Skills Investment
- 4.3.2 Legacy-System Integration Complexity
- 4.3.3 Data-Privacy Hurdles for Cloud-Based Testing
- 4.3.4 Rapid AI-Framework Obsolescence Risk
- 4.4 Industry Value Chain Analysis
- 4.5 Regulatory Landscape
- 4.6 Technological Outlook
- 4.7 Porter's Five Forces Analysis
- 4.7.1 Bargaining Power of Suppliers
- 4.7.2 Bargaining Power of Consumers
- 4.7.3 Threat of New Entrants
- 4.7.4 Threat of Substitutes
- 4.7.5 Intensity of Competitive Rivalry
- 4.8 Impact of Macroeconomic Factors on the Market
5 MARKET SIZE AND GROWTH FORECASTS (VALUES)
- 5.1 By Component
- 5.1.1 Solutions
- 5.1.1.1 Functional Testing
- 5.1.1.2 API Testing
- 5.1.1.3 Security Testing
- 5.1.1.4 Compliance Testing
- 5.1.1.5 Usability Testing
- 5.1.1.6 Load and Performance Testing
- 5.1.1.7 Other Solutions
- 5.1.2 Services
- 5.1.2.1 Professional Services
- 5.1.2.2 Managed Services
- 5.1.1 Solutions
- 5.2 By Testing Type
- 5.2.1 Functional
- 5.2.2 Non-Functional
- 5.2.2.1 Performance
- 5.2.2.2 Security
- 5.2.2.3 Usability
- 5.3 By Deployment Mode
- 5.3.1 On-Premises
- 5.3.2 Cloud
- 5.3.2.1 Public
- 5.3.2.2 Private
- 5.3.2.3 Hybrid
- 5.4 By End-User Industry
- 5.4.1 IT and Telecommunications
- 5.4.2 BFSI
- 5.4.3 Healthcare and Life Sciences
- 5.4.4 Retail and E-Commerce
- 5.4.5 Transportation and Logistics
- 5.4.6 Manufacturing
- 5.4.7 Government and Public Sector
- 5.4.8 Energy and Utilities
- 5.4.9 Other End-User Industries
- 5.5 By Organization Size
- 5.5.1 Large Enterprises
- 5.5.2 Small and Medium Enterprises
- 5.6 By Interface
- 5.6.1 Web
- 5.6.2 Mobile
- 5.6.3 Desktop
- 5.6.4 API / Micro-Services
- 5.6.5 IoT / Embedded
- 5.7 By Geography
- 5.7.1 North America
- 5.7.1.1 United States
- 5.7.1.2 Canada
- 5.7.1.3 Mexico
- 5.7.2 South America
- 5.7.2.1 Brazil
- 5.7.2.2 Argentina
- 5.7.2.3 Rest of South America
- 5.7.3 Europe
- 5.7.3.1 Germany
- 5.7.3.2 United Kingdom
- 5.7.3.3 France
- 5.7.3.4 Italy
- 5.7.3.5 Spain
- 5.7.3.6 Russia
- 5.7.3.7 Rest of Europe
- 5.7.4 Asia Pacific
- 5.7.4.1 China
- 5.7.4.2 Japan
- 5.7.4.3 South Korea
- 5.7.4.4 India
- 5.7.4.5 Australia
- 5.7.4.6 New Zealand
- 5.7.4.7 Rest of Asia Pacific
- 5.7.5 Middle East
- 5.7.5.1 United Arab Emirates
- 5.7.5.2 Saudi Arabia
- 5.7.5.3 Turkey
- 5.7.5.4 Rest of Middle East
- 5.7.6 Africa
- 5.7.6.1 South Africa
- 5.7.6.2 Nigeria
- 5.7.6.3 Kenya
- 5.7.6.4 Rest of Africa
- 5.7.1 North America
6 COMPETITIVE LANDSCAPE
- 6.1 Market Concentration
- 6.2 Strategic Moves
- 6.3 Market Share Analysis
- 6.4 Company Profiles
- 6.4.1 IBM Corporation
- 6.4.2 OpenText Corporation (Micro Focus)
- 6.4.3 Capgemini SE
- 6.4.4 Tricentis USA Corp
- 6.4.5 SmartBear Software Inc.
- 6.4.6 Parasoft Corporation
- 6.4.7 Cigniti Technologies Ltd.
- 6.4.8 Keysight Technologies Inc.
- 6.4.9 Sauce Labs Inc.
- 6.4.10 Accenture plc
- 6.4.11 Microsoft Corporation
- 6.4.12 Katalon Inc.
- 6.4.13 BrowserStack Inc.
- 6.4.14 LambdaTest Inc.
- 6.4.15 Leapwork A/S
- 6.4.16 Applitools Ltd.
- 6.4.17 Ranorex GmbH
- 6.4.18 Worksoft Inc.
- 6.4.19 Perfecto (Perforce Software Inc.)
- 6.4.20 Functionize Inc.
- 6.4.21 Testim.io Ltd.
- 6.4.22 Virtuoso QA Ltd.
- 6.4.23 Eggplant (Keysight)
- 6.4.24 mabl Inc.
- 6.4.25 HeadSpin Inc.
7 MARKET OPPORTUNITIES AND FUTURE OUTLOOK
- 7.1 White-Space and Unmet-Need Assessment

