PUBLISHER: Mordor Intelligence | PRODUCT CODE: 2124430

PUBLISHER: Mordor Intelligence | PRODUCT CODE: 2124430
China Transformer - Market Share Analysis, Industry Trends & Statistics, Growth Forecasts (2026 - 2031)
According to Mordor Intelligence, China transformer market size market size in 2026 is estimated at USD 18.91 billion, growing from 2025 value of USD 17.30 billion with 2031 projections showing USD 29.52 billion, growing at 9.31% CAGR over 2026-2031.
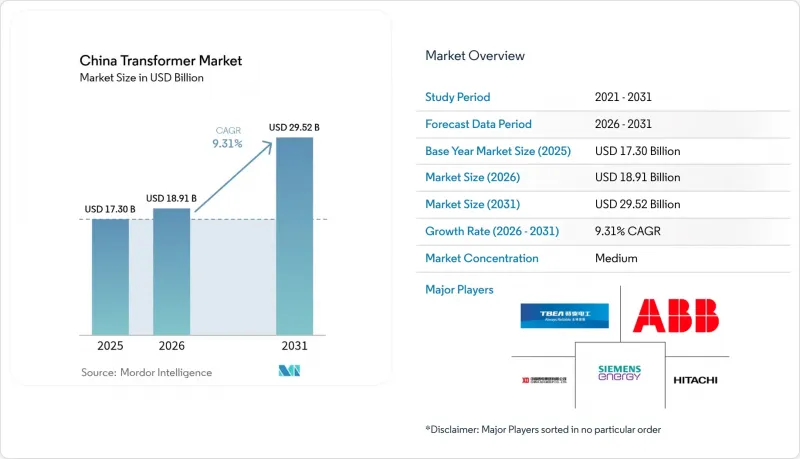
This report is Segmented by Power Rating (Large, Medium, and Small), Cooling Type (Air-Cooled and Oil-Cooled), Phase (Single-Phase and Three-Phase), Transformer Type (Power and Distribution), and End-User (Power Utilities, Industrial, Commercial, and Residential). The Market Sizes and Forecasts are Provided in Terms of Value (USD).
China Transformer Market Trends and Insights
14th Five-Year UHV Grid Build-Out
State Grid plans to construct 24 AC and 14 DC UHV links spanning over 30,000 km during the current plan period. Five new lines gained approval in 2024 with investments topping CNY 900 billion, 60% higher than earlier cycles. Converter transformers above 100 MVA form the backbone of these projects, and +-800 kV/8 GW standardization cuts construction lead times while boosting domestic content. The 1,901 km Jinsha River-Hubei UHVDC line underscores the need for robust, high-altitude-rated transformers. These projects anchor long-term demand, locking in factory orders years ahead of commissioning.
Mandatory Efficiency-Upgrade (S11/S13) Rollout
China's Industrial Energy Efficiency Improvement Action Plan calls for 80% of new transformers to meet S11/S13 standards by 2025. Energy-efficiency labels, which have been in force since February 2025, accelerate the replacement of legacy S9 units and shift procurement toward low-loss cores. State Grid's preference lists amplify market pull, giving high-efficiency suppliers pricing power. Retrofit momentum is strongest in power-intensive coastal provinces, where electricity costs significantly impact industrial margins. Manufacturers capture wider spreads on premium designs while phasing out low-efficiency lines.
GOES Steel Price Volatility & Shortages
A tight global supply base for grain-oriented electrical steel pushed transformer selling prices 60-80% above 2020 levels, stretching project budgets. A handful of mills control premium Hi-B grades, exposing Chinese manufacturers to abrupt cost spikes. Lead times for large units have doubled since 2019, exceeding 115 weeks at several plants. Substituting lower-grade steel undermines no-load loss targets, leaving utilities reluctant to accept performance trade-offs. Producers negotiate longer-term supply contracts and pursue in-house slitting lines to maintain or improve margins.
Other drivers and restraints analyzed in the detailed report include:
- Electrification of Metro & Rail Traction Demand
- EV Fast-Charging Corridor Build-Outs
- Lengthy State Grid Tender Cycles
For complete list of drivers and restraints, kindly check the Table Of Contents.
Segment Analysis
Large transformers above 100 MVA posted the fastest growth at a 9.69% CAGR, driven by UHVDC corridors that transport renewable energy from western bases to eastern load centers. Each +-800 kV terminal substation installs converter blocks exceeding 500 MVA, pushing factory test-bay utilization to capacity limits. Medium-rated units delivered 49.72% of shipments in 2025, servicing industrial substations, rail traction, and data-center campuses. Small units under 10 MVA retain relevance in rural electrification and distributed PV schemes but face margin compression amid commodity price swings. Supply tightness for >500 MVA cores grants incumbent producers pricing leverage, while export inquiries from Belt-and-Road markets provide cyclical hedging.
In the Chinese transformer market, large-capacity orders often bundle shunt reactors and phase-shifting units, raising average contract value and deepening OEM-utility collaboration. Medium-rated units benefit from shorter tender cycles and diversified demand across manufacturing clusters. The Chinese transformer industry continues to refine high-temperature insulation systems that widen thermal margins and permit overload operation without accelerated aging.
Oil-cooled units retained a 76.02% share in 2025, owing to proven dielectric strength and cost efficiency in high-voltage service. However, air-cooled alternatives expand at a 9.92% CAGR as municipal fire codes penalize oil-filled equipment in densely populated districts. Cast-resin and vacuum-impregnated technologies now achieve comparable loss levels, benefiting data-center builders who favor minimal containment infrastructure.
Air-cooled transformers are increasingly equipped with forced-ventilation ducts and aluminum heat exchangers, which enhance thermal dissipation. Suppliers integrate online temperature monitoring to predict fan failure risks, thereby extending maintenance intervals. Oil-cooled units remain indispensable for 220 kV and above, where high dielectric requirements and outdoor exposure outweigh the drawbacks associated with oil handling. Hybrid silicone oils with high flash points offer a transitional path, but they come at a premium cost.
Complete Report Scope:
- By Power Rating
- Large (Above 100 MVA)
- Medium (10 to 100 MVA)
- Small (Up to 10 MVA)
- By Cooling Type
- Air-cooled
- Oil-cooled
- By Phase
- Single-Phase
- Three-Phase
- By Transformer Type
- Power
- Distribution
- By End-User
- Power Utilities (includes, Renewables, Non-renewables, and T&D)
- Industrial
- Commercial
- Residential
List of Companies Covered in this Report:
- Siemens AG
- ABB Ltd.
- General Electric Co.
- Mitsubishi Electric Corp.
- Schneider Electric SE
- Hitachi Energy Ltd.
- TBEA Co., Ltd.
- China XD Group
- NR Electric Co., Ltd.
- Baoding Tianwei Baobian Electric Co., Ltd.
- JiangSu HuaPeng Transformer Co., Ltd.
- Shanghai Electric Group Co., Ltd.
- Qingdao TGOOD Electric Co., Ltd.
- Changzhou Toshiba Transformer Co., Ltd.
- Guangdong Power Grid Equipment Co.
- Chint Group Co., Ltd.
- Shandong Electric Equipment Group (SEEG)
- XJ Electric Co., Ltd.
- Fengtou Technology (Group) Co., Ltd.
- Senergy Electric Co., Ltd.
Additional Benefits:
- The market estimate (ME) sheet in Excel format
- 3 months of analyst support
TABLE OF CONTENTS
1 Introduction
- 1.1 Study Assumptions & Market Definition
- 1.2 Scope of the Study
2 Research Methodology
3 Executive Summary
4 Market Landscape
- 4.1 Market Overview
- 4.2 Market Drivers
- 4.2.1 14th Five-Year UHV grid build-out
- 4.2.2 Mandatory efficiency-upgrade (S11/S13) rollout
- 4.2.3 Electrification of metro & rail traction demand
- 4.2.4 EV fast-charging corridor build-outs
- 4.2.5 Data-centre MV substation boom
- 4.2.6 Bidirectional smart DTs for rooftop PV + storage
- 4.3 Market Restraints
- 4.3.1 GOES steel price volatility & shortages
- 4.3.2 Lengthy State Grid tender cycles
- 4.3.3 Skilled coil-winding labour scarcity inland
- 4.3.4 Cyber-security compliance costs on digital units
- 4.4 Supply-Chain Analysis
- 4.5 Regulatory Landscape
- 4.6 Technological Outlook
- 4.7 Porter's Five Forces
- 4.7.1 Threat of New Entrants
- 4.7.2 Bargaining Power of Suppliers
- 4.7.3 Bargaining Power of Buyers
- 4.7.4 Threat of Substitutes
- 4.7.5 Competitive Rivalry
- 4.8 PESTLE Analysis
5 Market Size & Growth Forecasts
- 5.1 By Power Rating
- 5.1.1 Large (Above 100 MVA)
- 5.1.2 Medium (10 to 100 MVA)
- 5.1.3 Small (Up to 10 MVA)
- 5.2 By Cooling Type
- 5.2.1 Air-cooled
- 5.2.2 Oil-cooled
- 5.3 By Phase
- 5.3.1 Single-Phase
- 5.3.2 Three-Phase
- 5.4 By Transformer Type
- 5.4.1 Power
- 5.4.2 Distribution
- 5.5 By End-User
- 5.5.1 Power Utilities (includes, Renewables, Non-renewables, and T&D)
- 5.5.2 Industrial
- 5.5.3 Commercial
- 5.5.4 Residential
6 Competitive Landscape
- 6.1 Market Concentration
- 6.2 Strategic Moves (M&A, Partnerships, PPAs)
- 6.3 Market Share Analysis (Market Rank/Share for key companies)
- 6.4 Company Profiles (includes Global level Overview, Market level overview, Core Segments, Financials as available, Strategic Information, Products & Services, and Recent Developments)
- 6.4.1 Siemens AG
- 6.4.2 ABB Ltd.
- 6.4.3 General Electric Co.
- 6.4.4 Mitsubishi Electric Corp.
- 6.4.5 Schneider Electric SE
- 6.4.6 Hitachi Energy Ltd.
- 6.4.7 TBEA Co., Ltd.
- 6.4.8 China XD Group
- 6.4.9 NR Electric Co., Ltd.
- 6.4.10 Baoding Tianwei Baobian Electric Co., Ltd.
- 6.4.11 JiangSu HuaPeng Transformer Co., Ltd.
- 6.4.12 Shanghai Electric Group Co., Ltd.
- 6.4.13 Qingdao TGOOD Electric Co., Ltd.
- 6.4.14 Changzhou Toshiba Transformer Co., Ltd.
- 6.4.15 Guangdong Power Grid Equipment Co.
- 6.4.16 Chint Group Co., Ltd.
- 6.4.17 Shandong Electric Equipment Group (SEEG)
- 6.4.18 XJ Electric Co., Ltd.
- 6.4.19 Fengtou Technology (Group) Co., Ltd.
- 6.4.20 Senergy Electric Co., Ltd.
7 Market Opportunities & Future Outlook
- 7.1 White-space & Unmet-Need Assessment

